Silver
It is broadly used in industry and at the same time is considered as precious metal. Moreover, the price at the first sight seems interesting, but the pricing of the silver as the financial asset on the exchange is different as it is in the case of gold. Therefore, we can not definitely say if it is over or under valuated based just on the price difference.
Correlation
The important thing in trading or investing in the same sector as commodities, or to be more specific, metals sector, is correlation. Whole economic sector is driven by similar inputs from industry or politics. For example, presidential vote in France helps precious metals, because Le Pen is in the second round and there is possibility, in the case of her win, of worsening EU political unity.
We have also informed about this topic: Technical analysis of Gold – levels checkup
These inputs affect whole sector and it gives more appropriate trading options to investor. Therefore, there is correlation among different financial assets, which shows statistical similarity in price moves.
The chart below compares price moves between Silver (black line) and Gold (yellow line) from the beginning of the year until today. Gold has made 6.97% and Silver 7.53%.
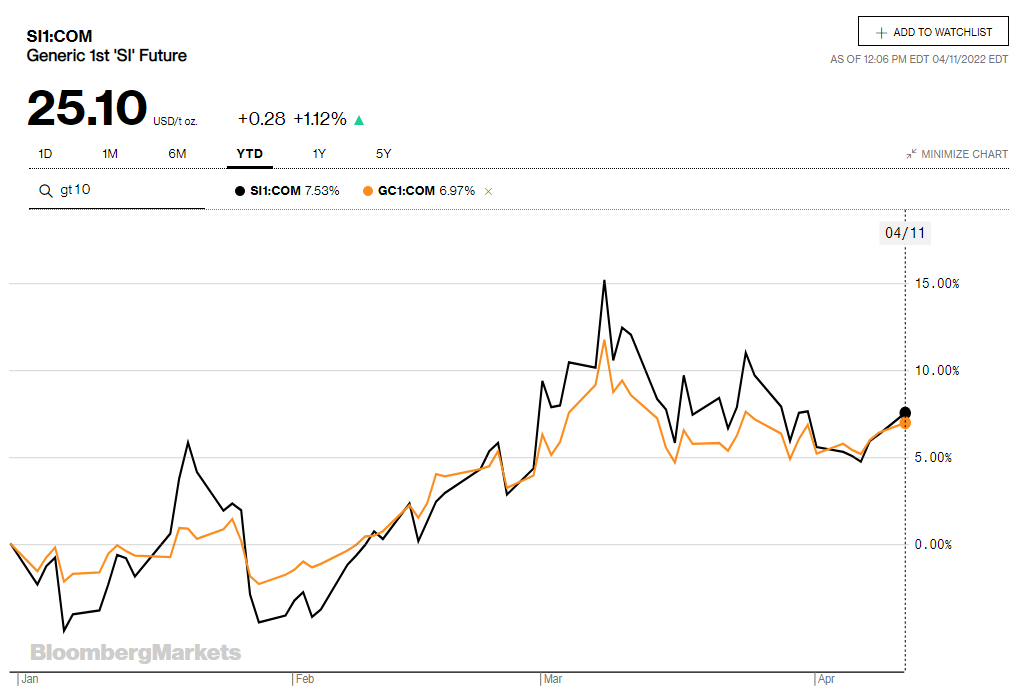
Year to date chart of Gold/Silver comparison. Source: Bloomberg.com
In addition, closer look to the correlation table below shows very strong positive correlation, where the highest possible number is 1 (100% same move for both assets) and on the other side -1, which represents directionally opposite move.
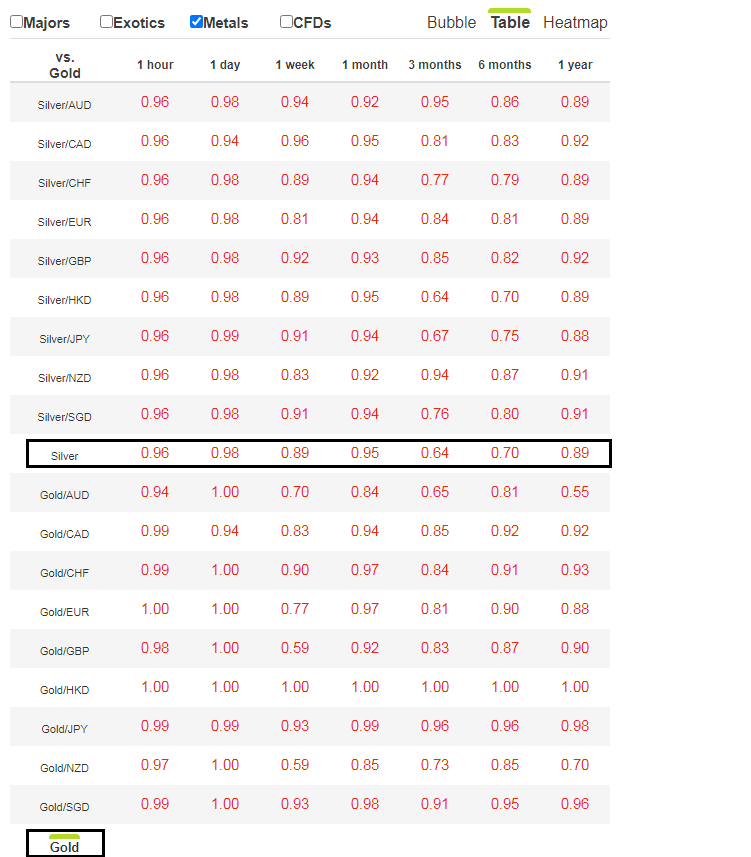
Correlation table Silver vs. Gold. Source: Oanda.com
It is very visible that correlation is very strong not just in the short time periods, but in the long term periods as well, where one year correlation between silver and gold is 89%.
Related: Statistical, technical and behavioral analysis of Silver
Better insight
Correlation is frequently considered as technical analysis, yet, more appropriate is statistical analysis. It gives you hard data and provides better chance to manage your portfolio.


Comments
Post has no comment yet.