Basic technical analysis
Gold has been declining for the month. Fundaments have been warning markets, that rising interest rates could be the one of the main factors with negative impact on the price. We have informed about this particular situation on markets several times. Yellow metal is in downtrend, and chart below shows how the prices have declined so far.
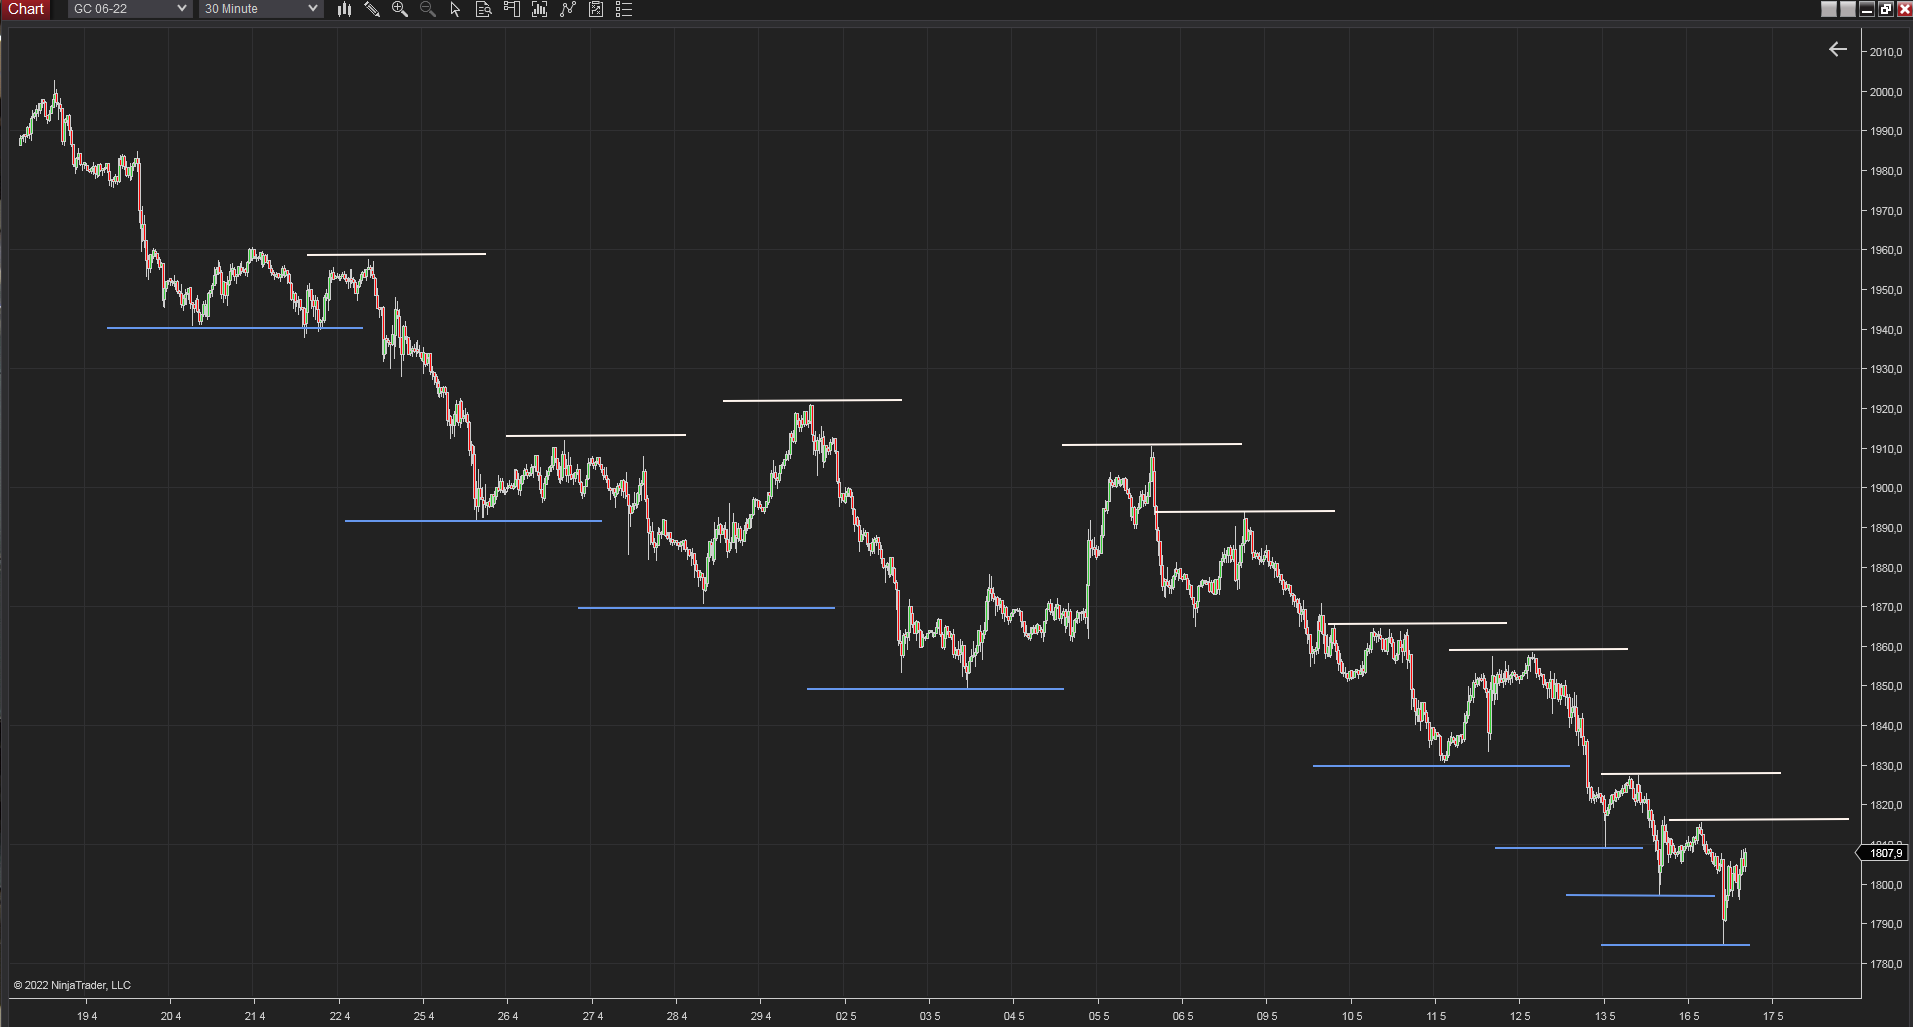 30 minutes chart of GC (gold futures), Source: Author´s analysis
Definition of downtrend is that the price move sets lower lows and lower highs. In this situation blue lines represent lows and white lines are highs. Chart history is from 18th of April, so we have almost a month for this analysis.
We have informed about this topic: Gold plunged under 1900$
Never guess the low
Guessing the low or the top is based on, predominantly, investor’s personal opinion. Feelings must not be a part of any trading strategy. Psychological behaviour on ‘floor’ is very important and guessing the move just by the feeling is not suitable.
The example, “the price felt too much, it has to turn up” is just wrong. It is one of the most common mistakes in trading overall. Price does not have to change, on the contrary, the price could continue in downtrend. The probability of going up or down is the same for a price of 1900$ as for 1700$. What it is needed to say is that data from technical, fundamental and statistical analysis could show possible change in trend. Follow data, not your feelings.
Divergence delta
Delta between bid and ask in the market shows which side of the market is stronger. Bigger ask pushes the price up, on the other side, bigger bid pushes it down. Delta shows the difference between ask and bid. So if the price goes down but delta goes up, we have a divergence between price and delta.
In the chart below is seen first small divergence in gold’s downtrend. Where delta and cumulative delta is going slightly up, meaning ask is bigger then bid, but the price continues down. 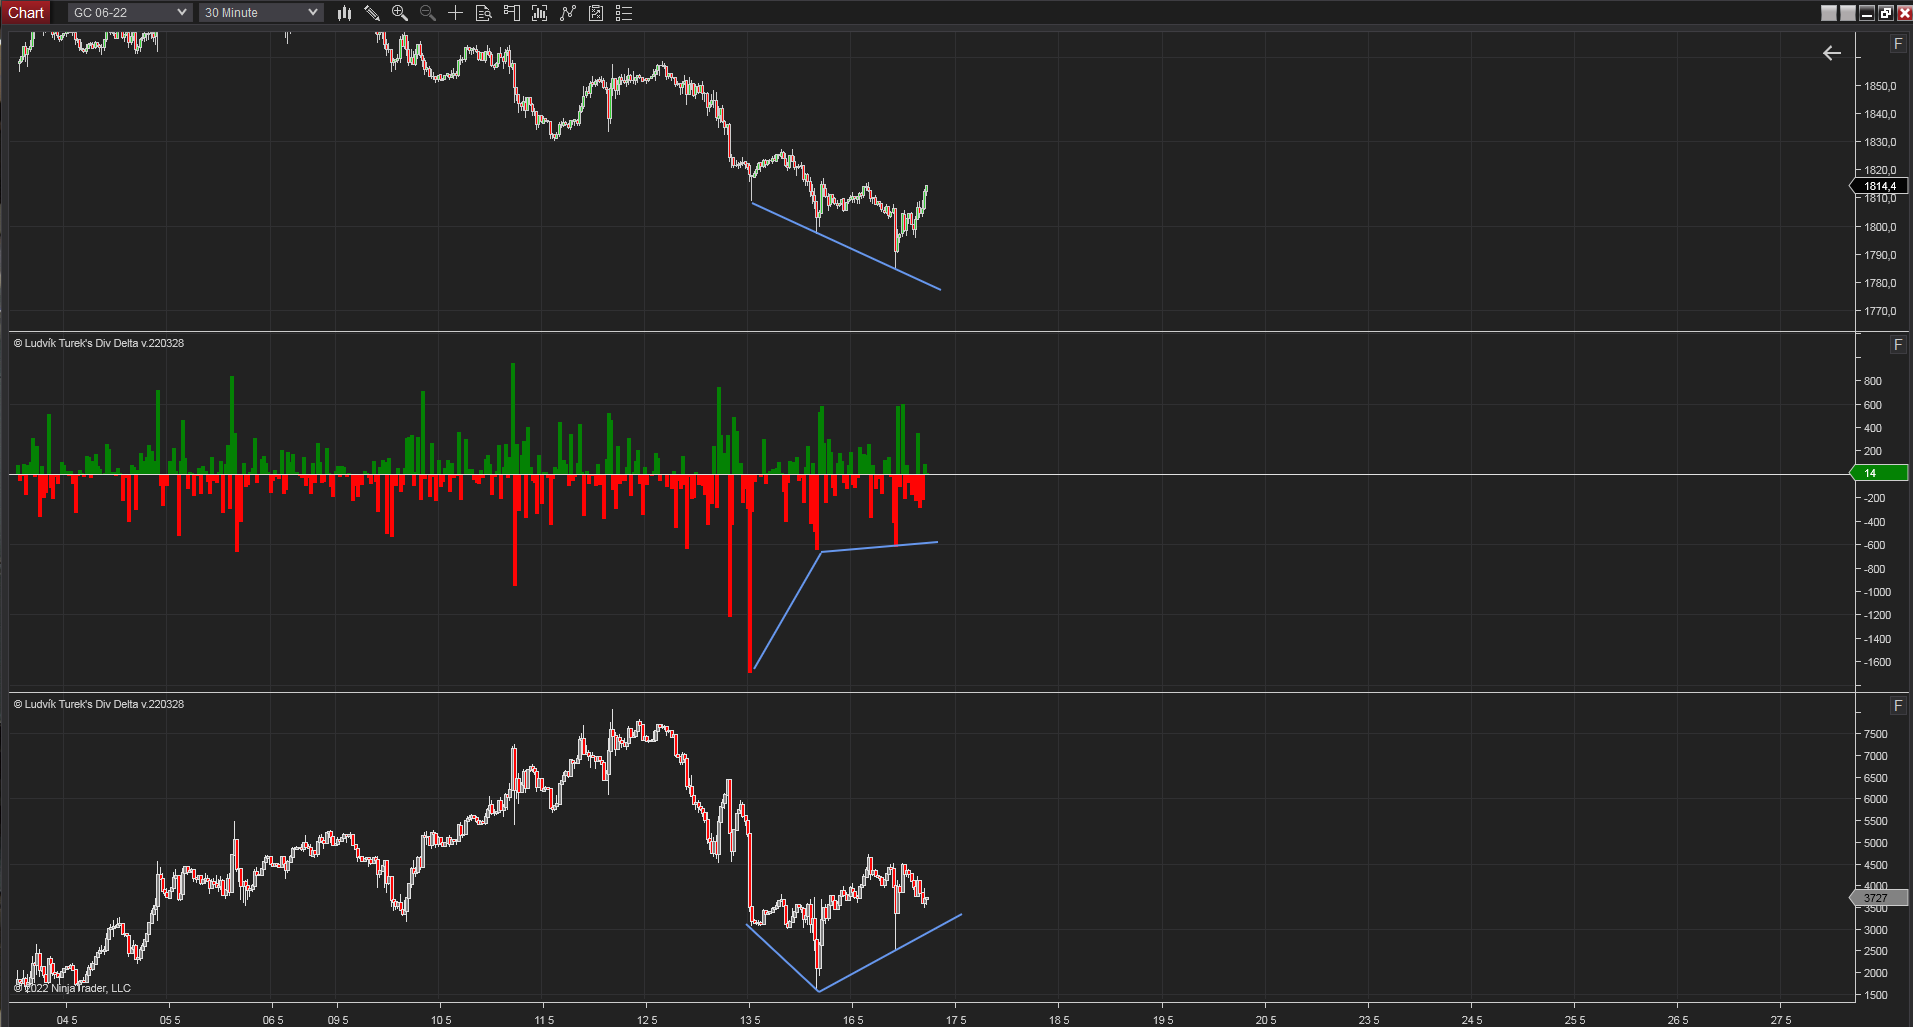
30 minutes chart of GC, Divergence delta indicator. Source: Author’s analysis
Data vs. feelings
This chart does not predict the change of trend, it only compares who is stronger in the market and if the price is adequate to this delta. The point is that if you want to make a trade decision, you need to collect a data from fundaments and chart indicators or use statistical analysis. Feelings like “this must go up” does not work in long-term and successful basis.
Read more about statistical analysis: Statistical and technical analysis of platinum


Comments
Post has no comment yet.