The US market and economy are the most watched in the world during the first inflation drop, very low unemployment rate, and rising interest rates. These events and data drive volatility, which often offer interesting trading signals.
Related blog: Crypto outlook: Ethereum, Litecoin, and Algorand
GBP/USD chart
The British pound took a beat in the last couple of months as it declined rapidly against the US dollar. The massive fall from 1.3700 at the beginning of 2022 to 1.1800 is mainly due to rate hikes in USA. However, many traders now see reversal trading signals, potentially forming a bottom. The already-mentioned rate hikes are probably priced in, so correction upwards is possible.
Technical analysis of GBP/USD suggests a movement from 1.22 to 1.265, or 1.3 might be on the way in the next few weeks. An apparent false breakout below the pink area and breakout of the trend line to the upside are strong signals of the market rejecting to fall further. There is also a price formation reversed head and shoulders, so a 400-pip move upwards can look likely.
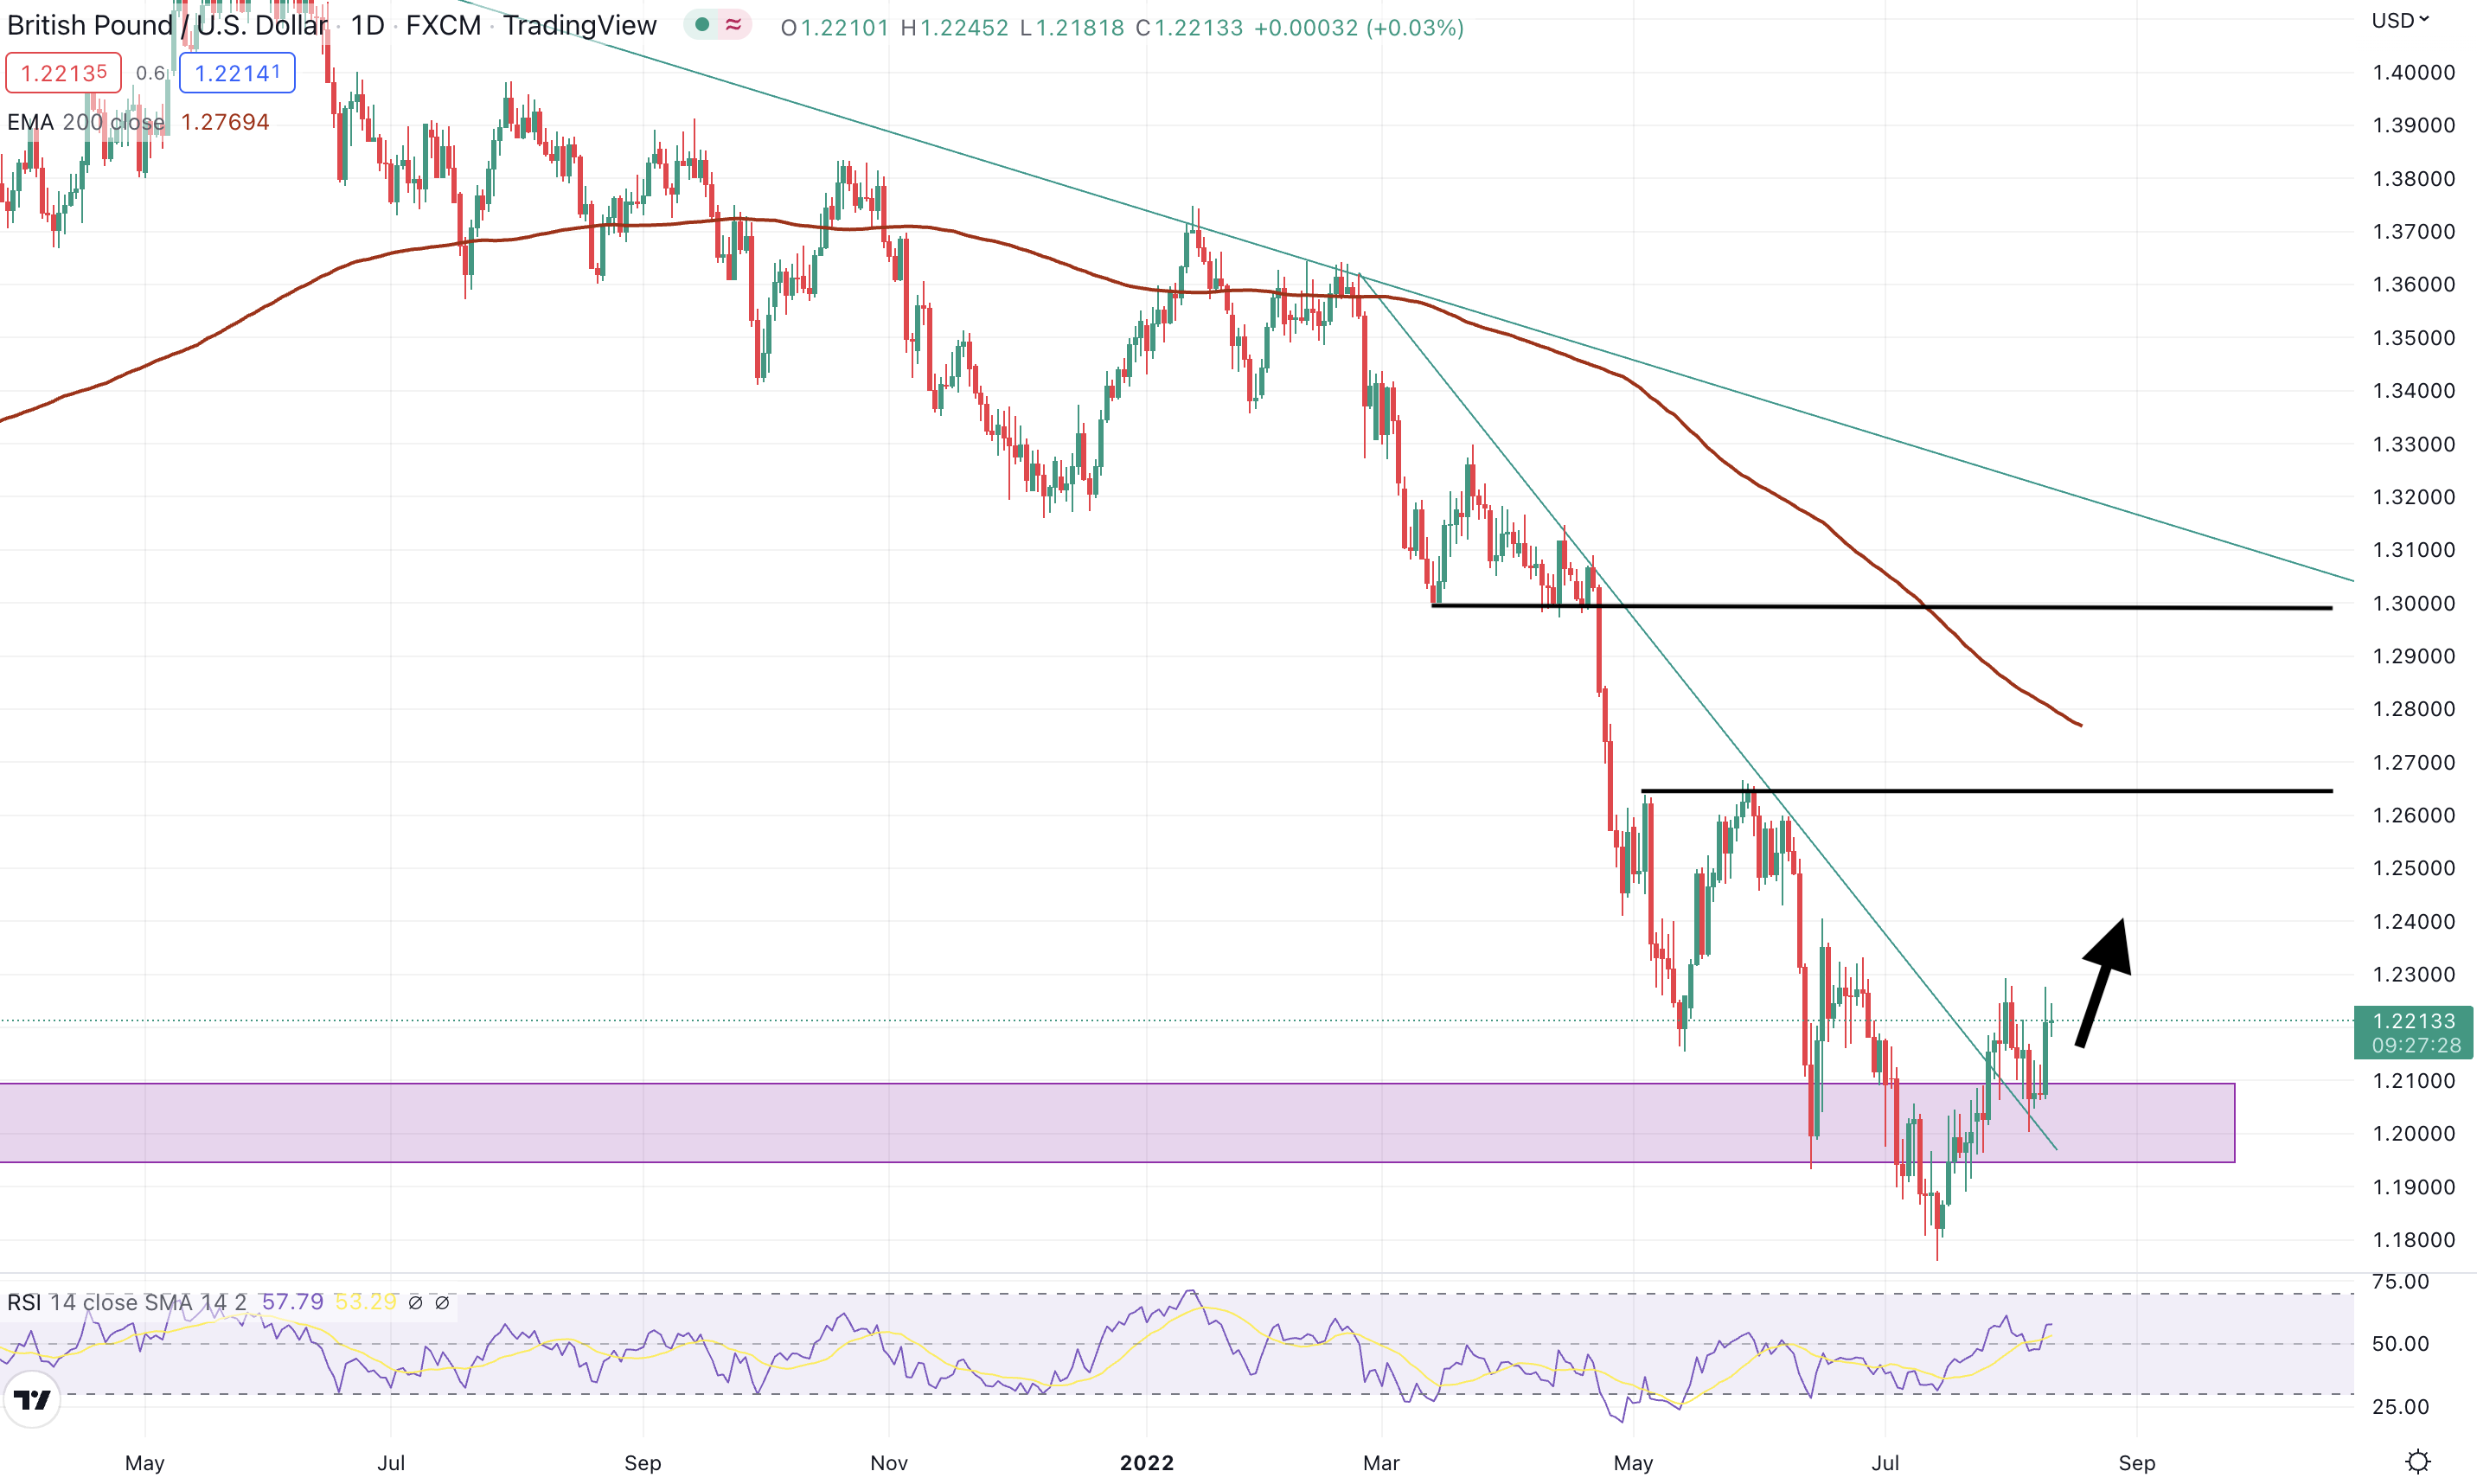
GBPUSD daily chart, source: tradingview.com
You may also read: Stocks may fall further despite the inflation drop
USD/CHF chart
USD/CHF clearly rejected going above the parity as the EUR/USD declined to go below parity too. These two currency pairs have an inverse correlation, and as the bottom on the eurodollar might be in, USD/CHF has just confirmed the possible continuation of an already started downtrend. The market was in an uptrend until June when it refused to rise further above the 1.000 level.
Afterward, USD/CHF created lower highs and lower lows, indicating the start of a bear market. There was a clean breakout of level 0.949, and the moving average (EMA200) and further declines are likely to happen. The best possible entry in a short position might be near the trend line and resistance 0.949, potentially moving to the first significant level at 0.92. However, more good news for the US dollar could disrupt this technical set-up.
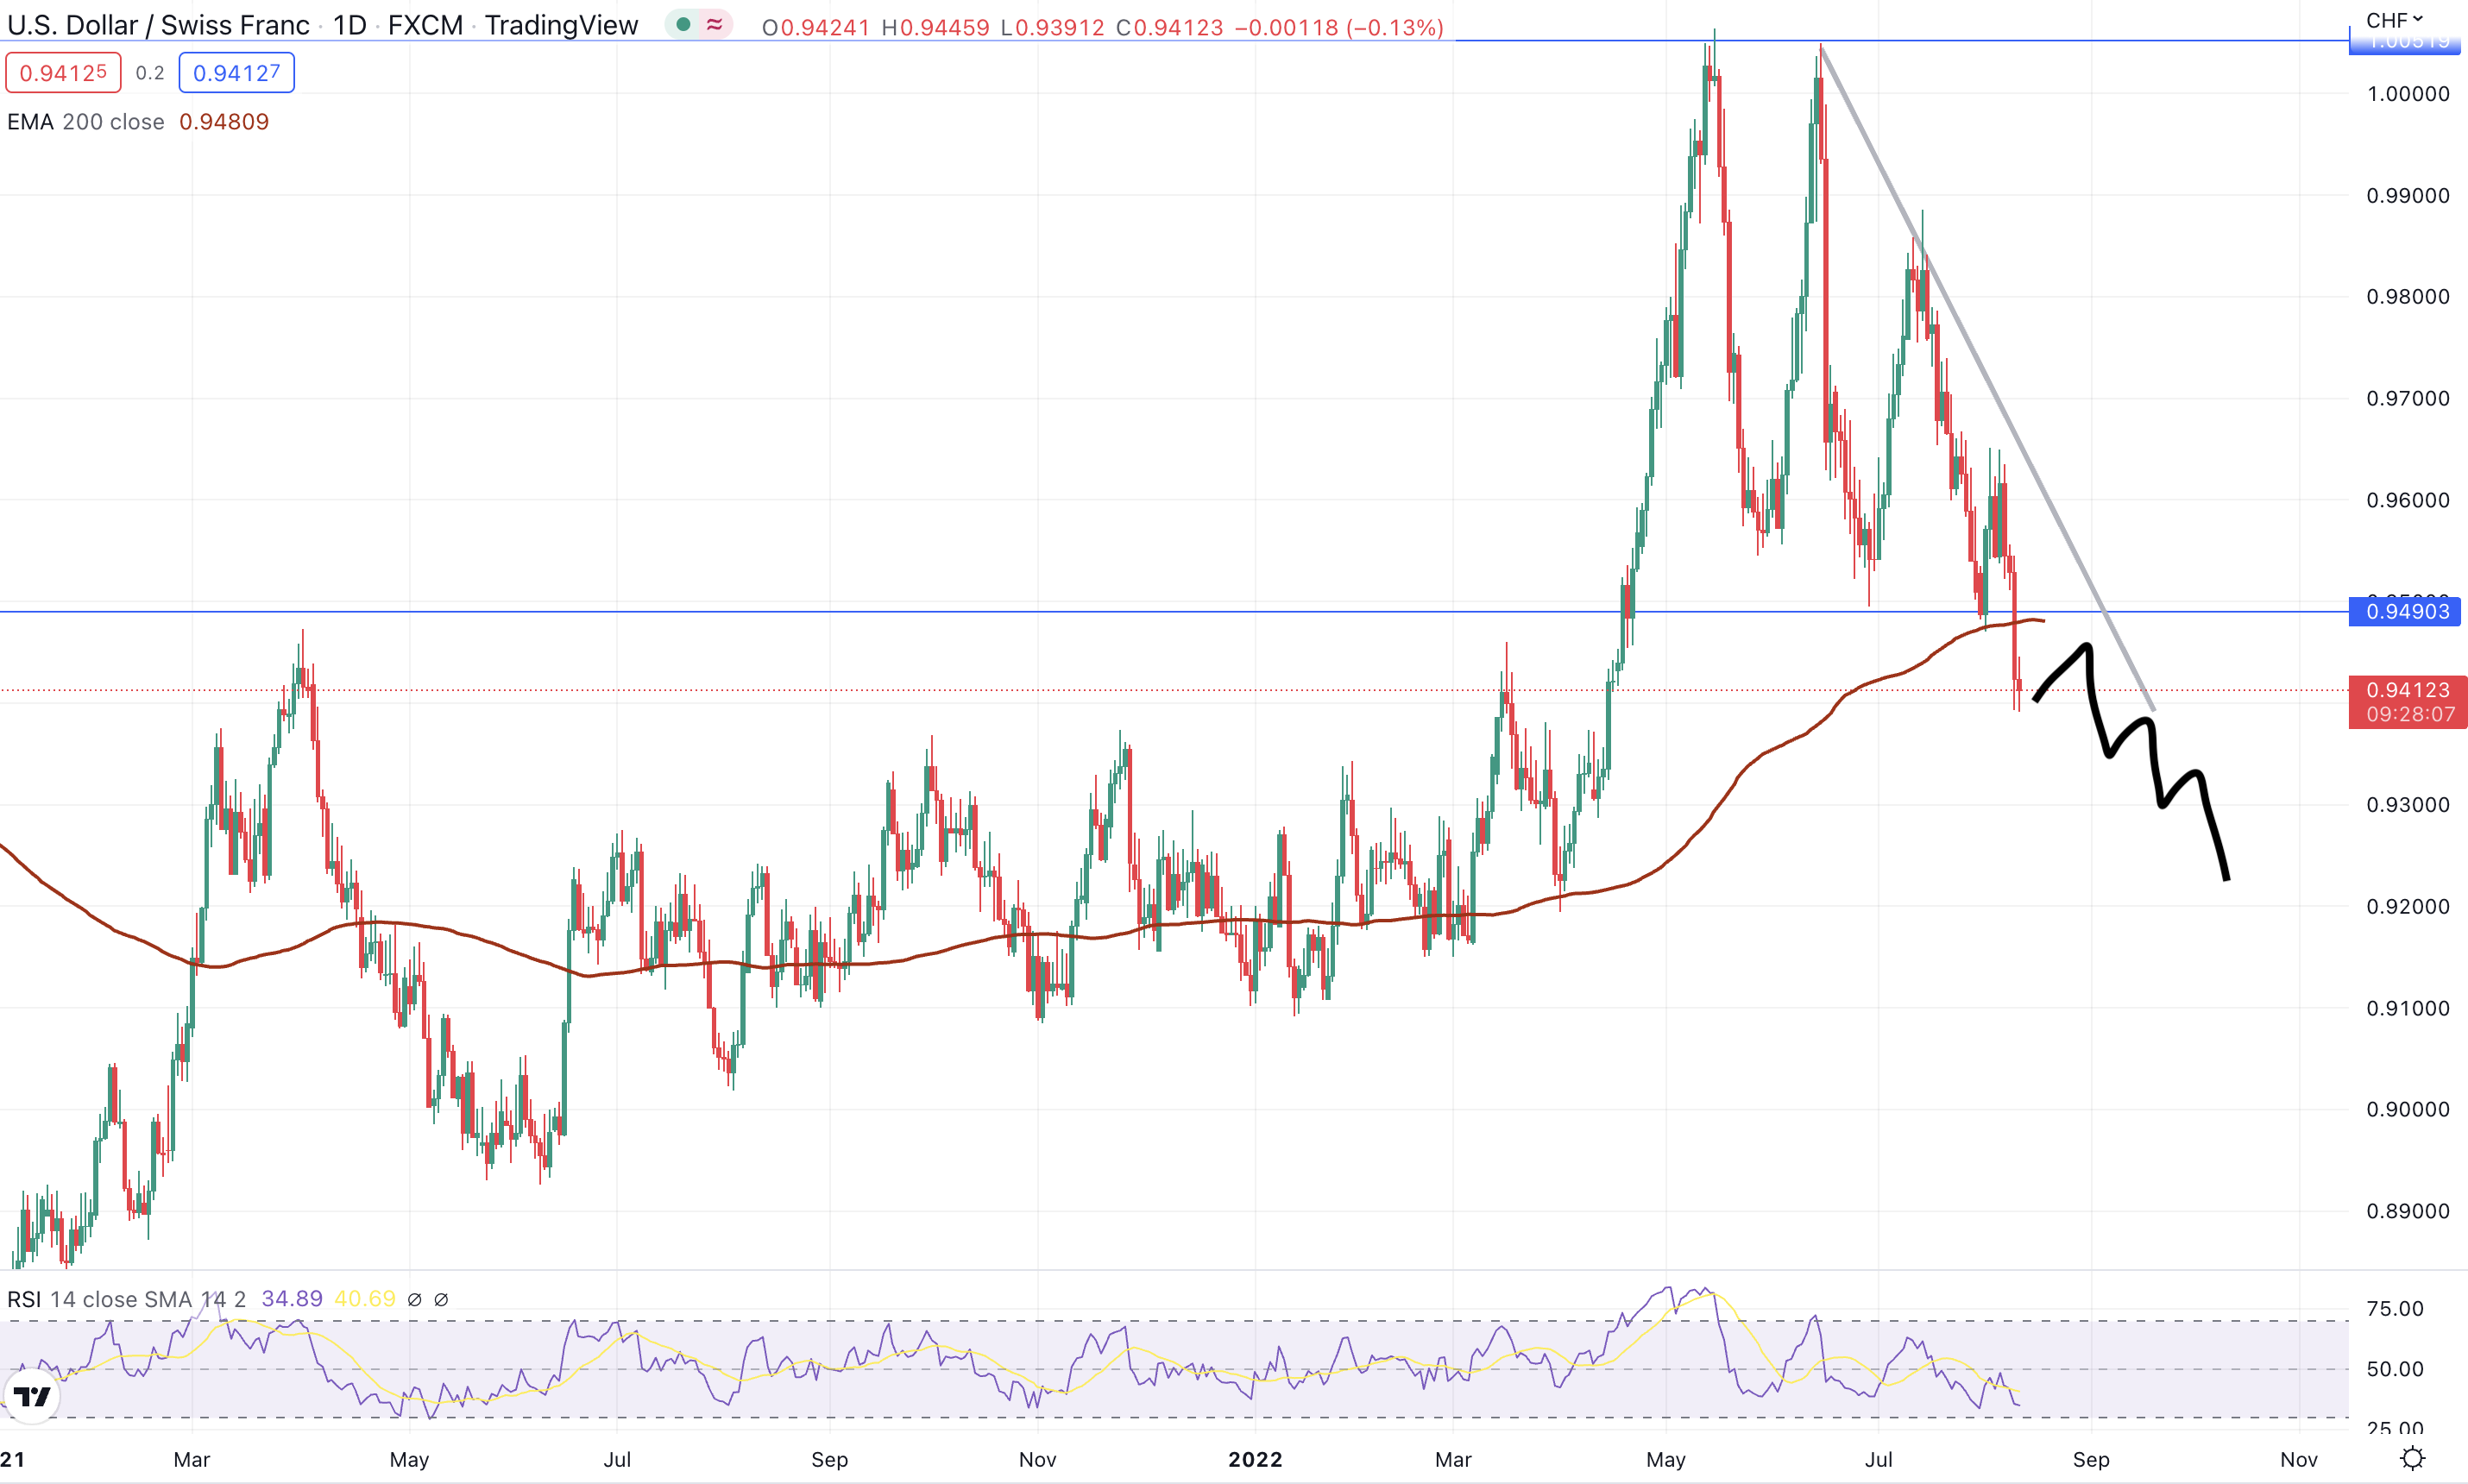
USDCHF daily chart, source: tradingview.com
GBP/JPY chart
GBP/JPY moved in a range of 1,000 pips in the last couple of months, and many traders could have been confused about which way the market would move next. Currently, GBP/JPY is sitting at a crucial trend line, from which it can bounce back up to the 168.38 level or break it and go to the pink zone at 158.
The market bounced from the trend line several times, but the more bounces from a trend line there are, the more likely the market is to break it. GBP/JPY also created a few lower highs, suggesting a possible downturn soon.
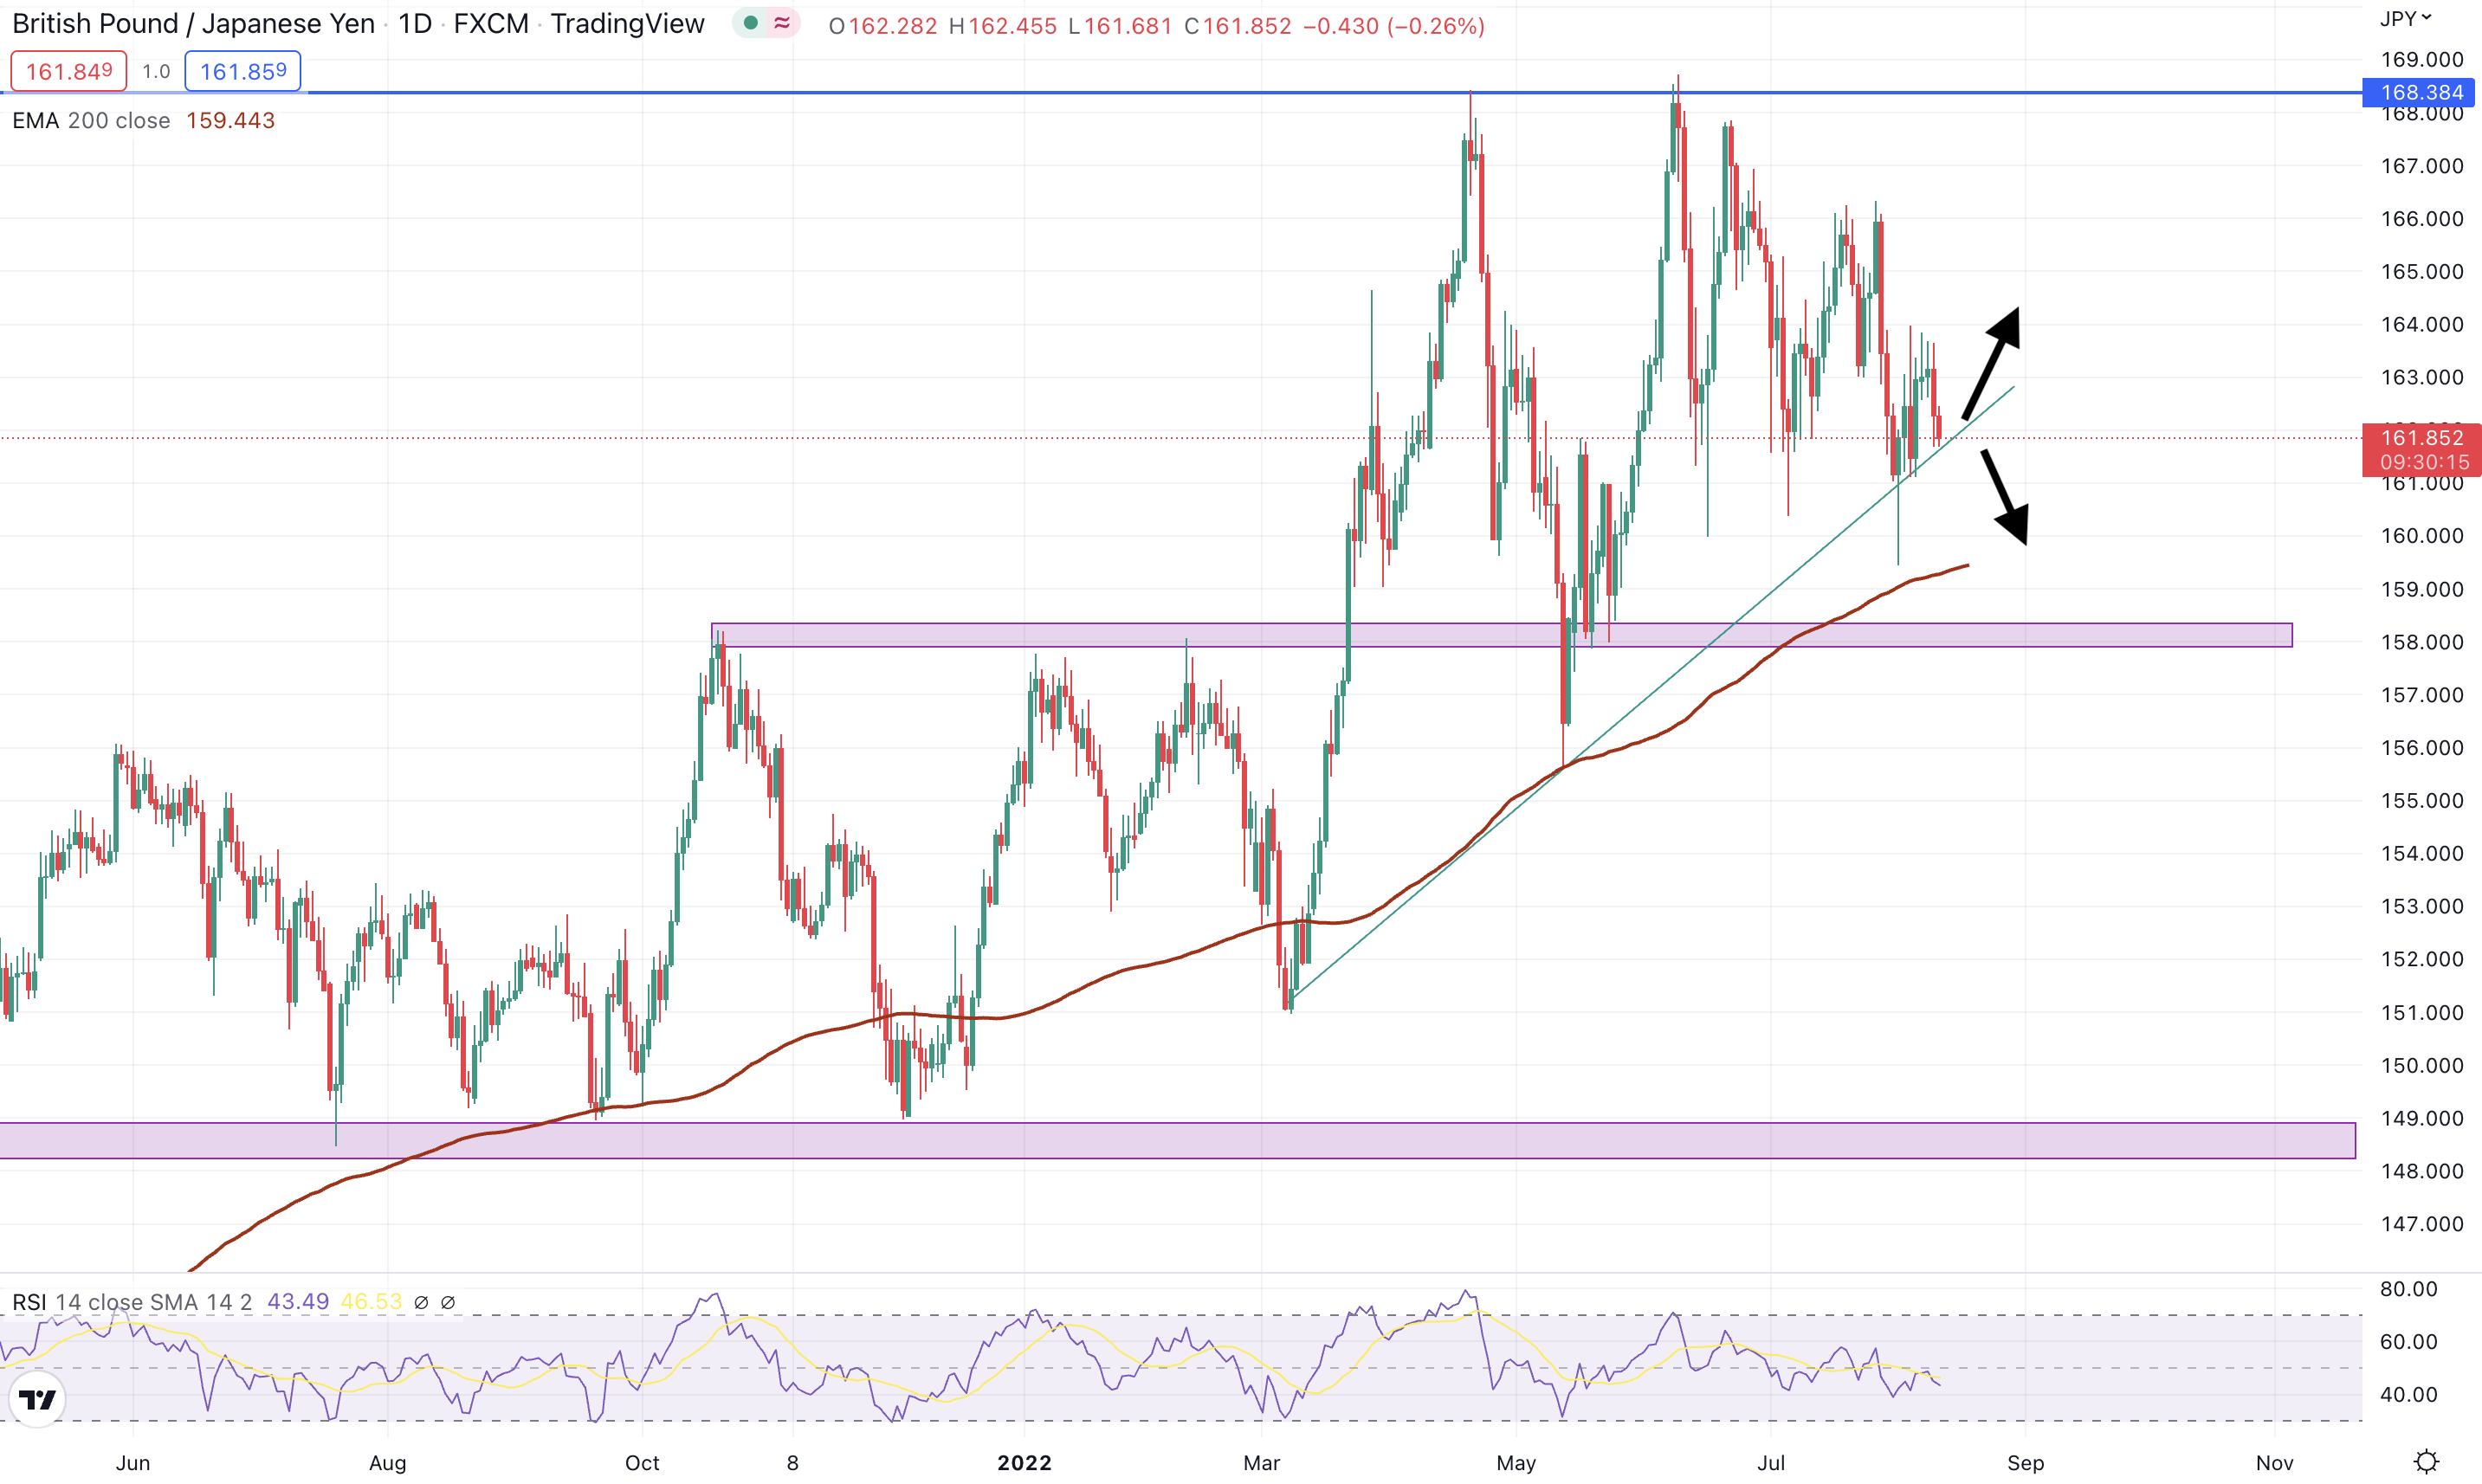
GBPJPY daily chart, source: tradingview.com
Conclusion
All these three currency pairs were analyzed through technical analysis, so if some important data come out, it can influence the price and break the structure of charts. Therefore, consider using a positive risk-reward ratio, adequate leverage, and placing a stop-loss before entering a trade.


Comments
Post has no comment yet.