As stocks continue to tumble, the eurodollar gets below parity, and many other vital events surface, there are different trading opportunities worth mentioning, specifically in Forex markets.
GBP/USD outlook
GBP/USD highly correlates with EUR/USD, and a strong dollar causes all these currency pairs to fall hard. GBP/USD retested previous support from July and now begs the question of whether this is a bounce or a breakout. Even more important is that this currency pair is nearing support from the COVID flash crash in 2020 and support from times when there was Brexit. The zone 1.1400 is solid and could be an excellent buy signal if the markets get there. Let’s have a look at the daily timeframe first.
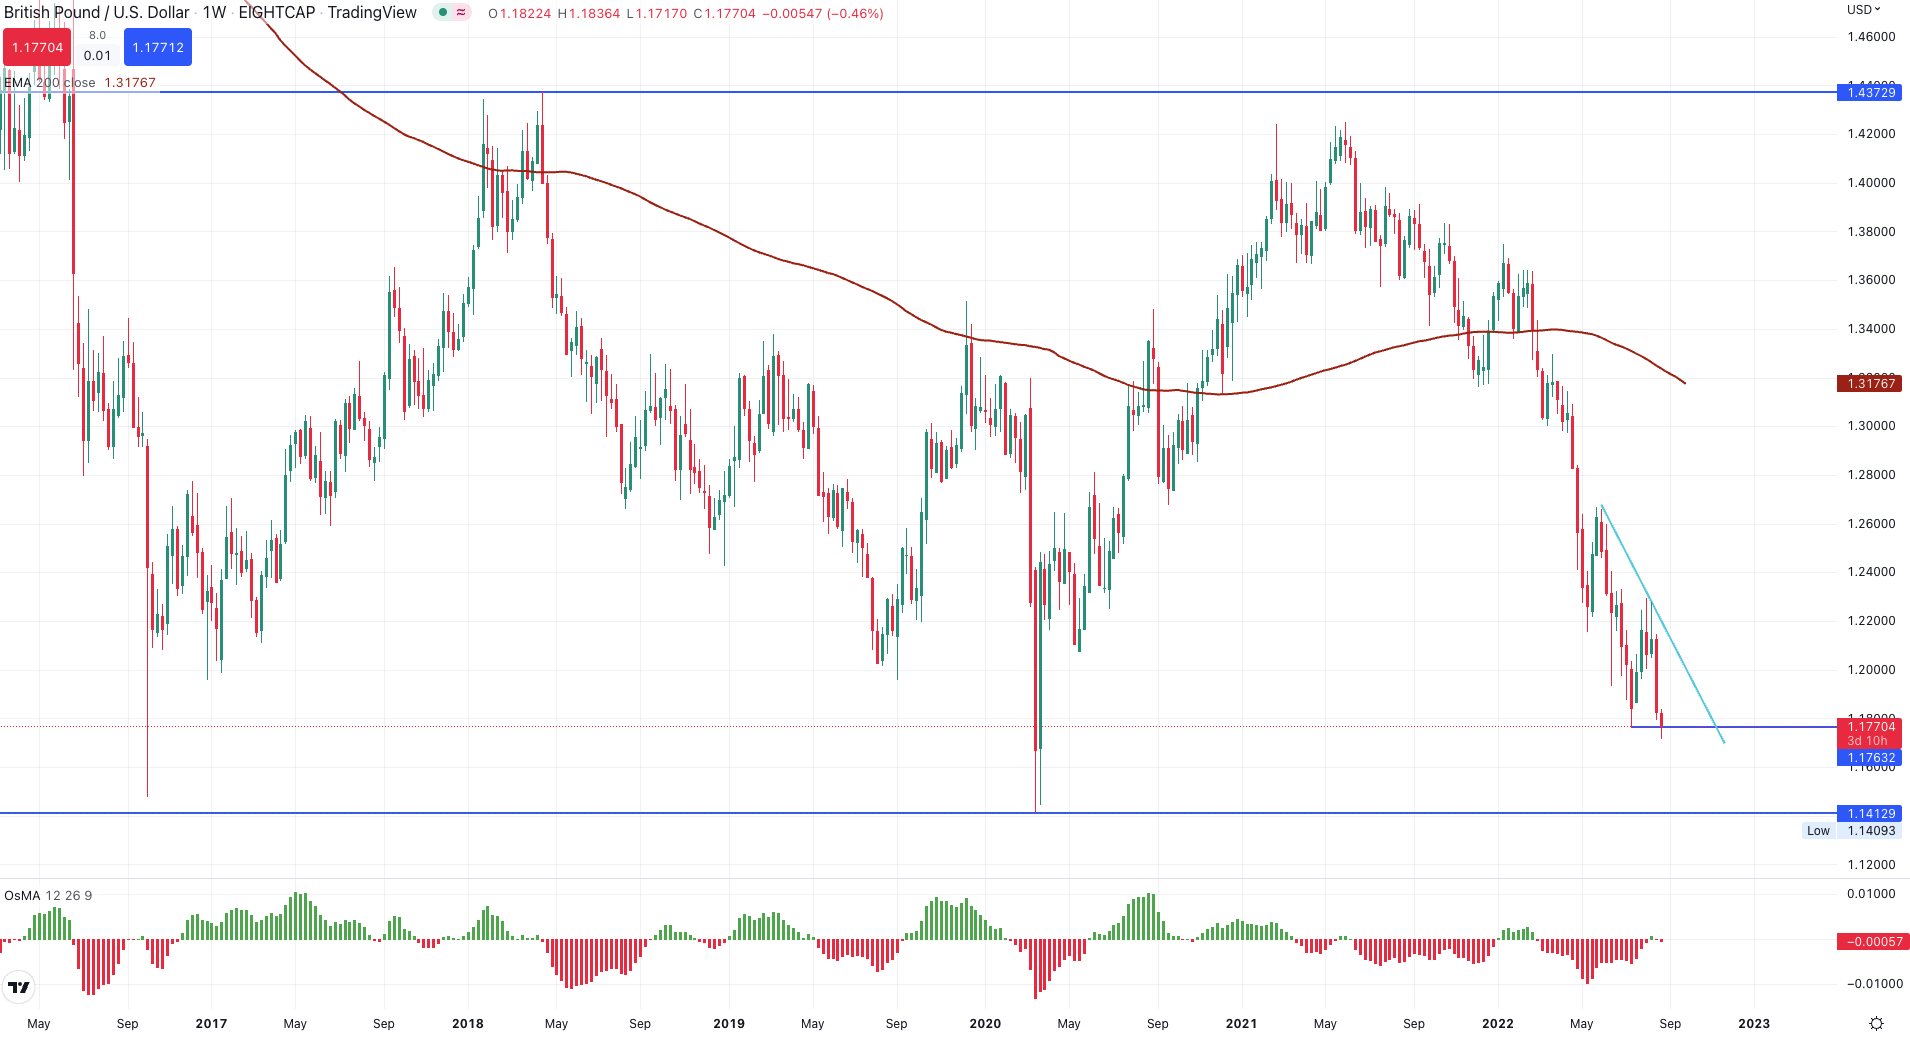
gbpusd weekly chart, source: tradingview.com
A clear downtrend is prevailing on GBP/USD, and current support will probably not be strong enough to send the currency pair flying upward. Although there might be a slight correction upwards to the blue trend line, is it more likely to break the support and finally get to 1.1410, which is the primary support. Furthermore, Fed increasing interest rates in September could escalate this downtrend and form at least a local bottom.
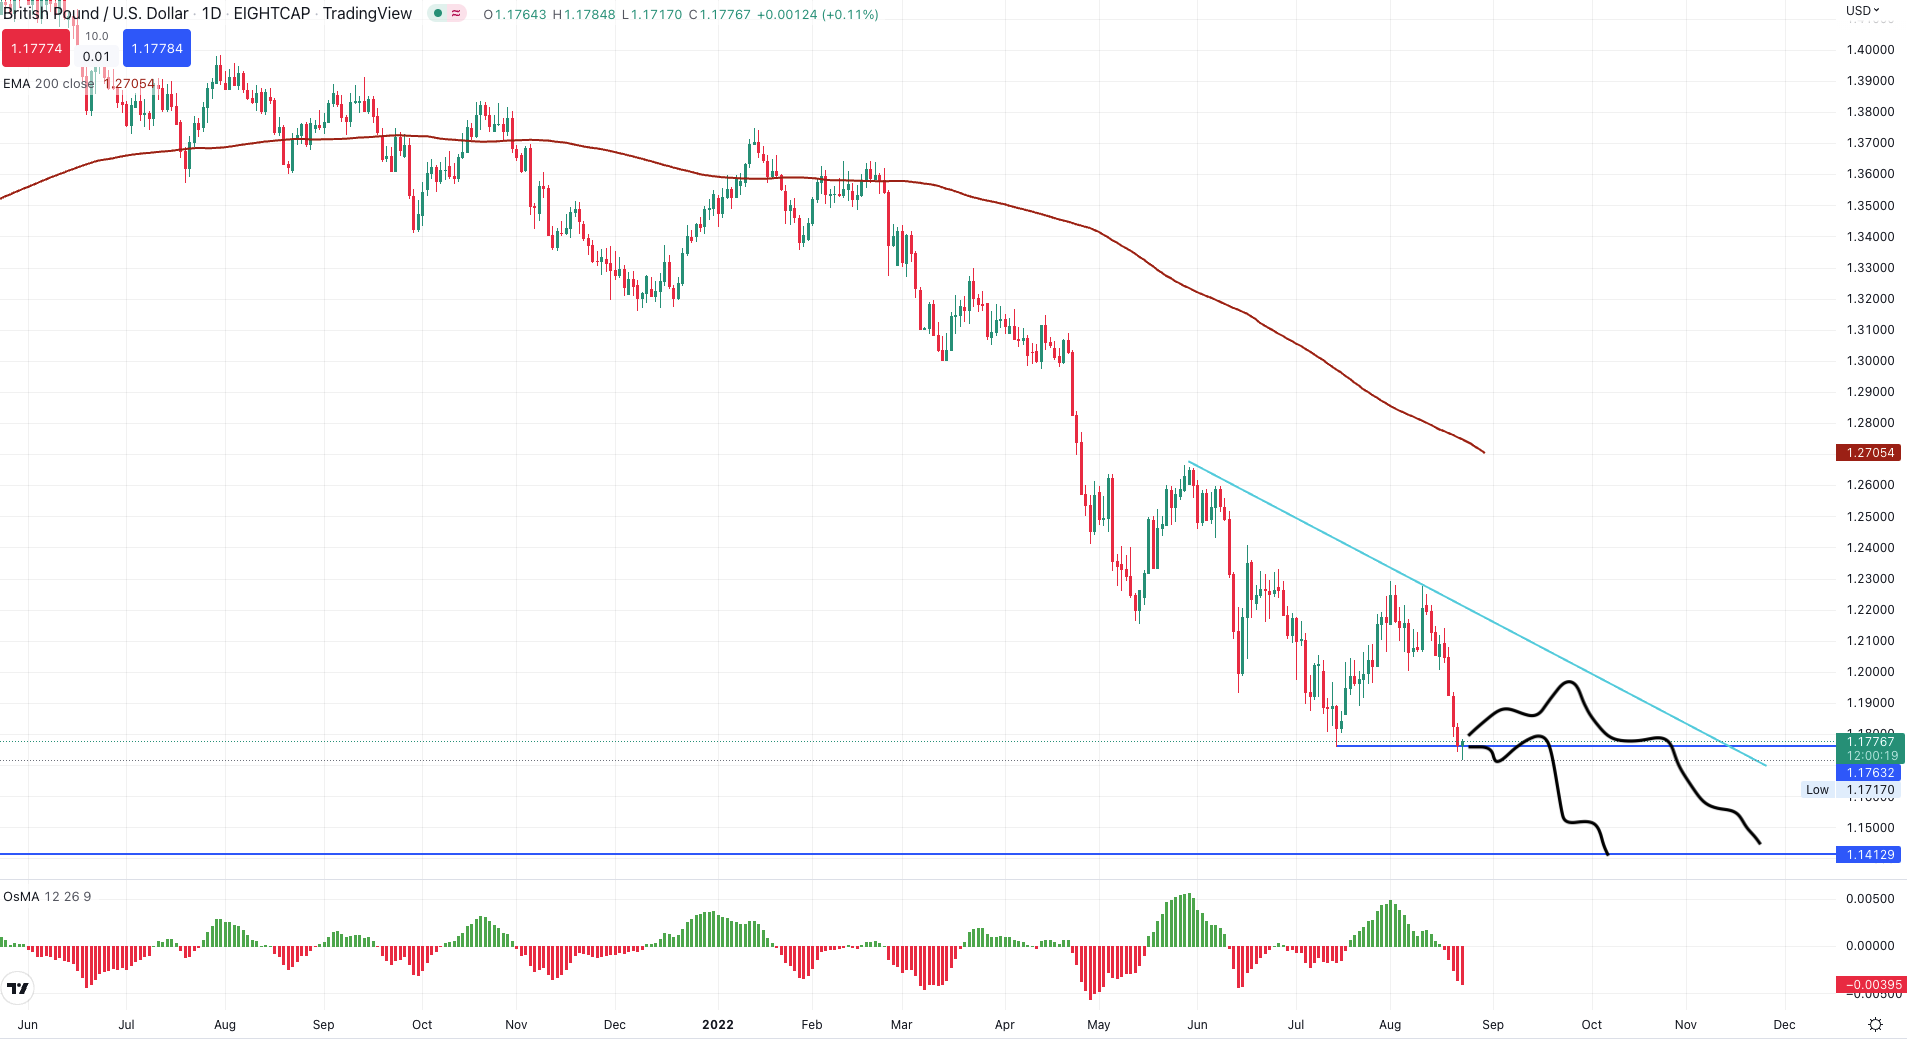
gbpusd daily chart, source: tradingview.com
As one euro is worth less than one American dollar, it causes many negative effects that the eurozone and US do not want. Although it can temporarily go a few hundred pips below parity, it always comes back. The UK does not want that too, so breaking that important level 1.1400 could have disastrous effects, mainly on the UK.
CHF/JPY outlook
CHF/JPY is in a giant uptrend but has been moving sideways in the last few months. A solid triple top is just forming in the chart, and significant downward movement could come if the bearish signal is confirmed. When the trend line gets broken, CHF/JPY could head all the way to the closest support, which is 137.15.
You can also read: Is another stock market selloff on the way?
If the move is strong enough, it could even go a little lower in the pink zone because there is also support, a trend line, and a moving average (EMA200). On the other hand, if the currency pair fails to break the current trend line and gets above the triple top pattern, it is game on for bulls. In one or two days, it will be clear which way market will move next.
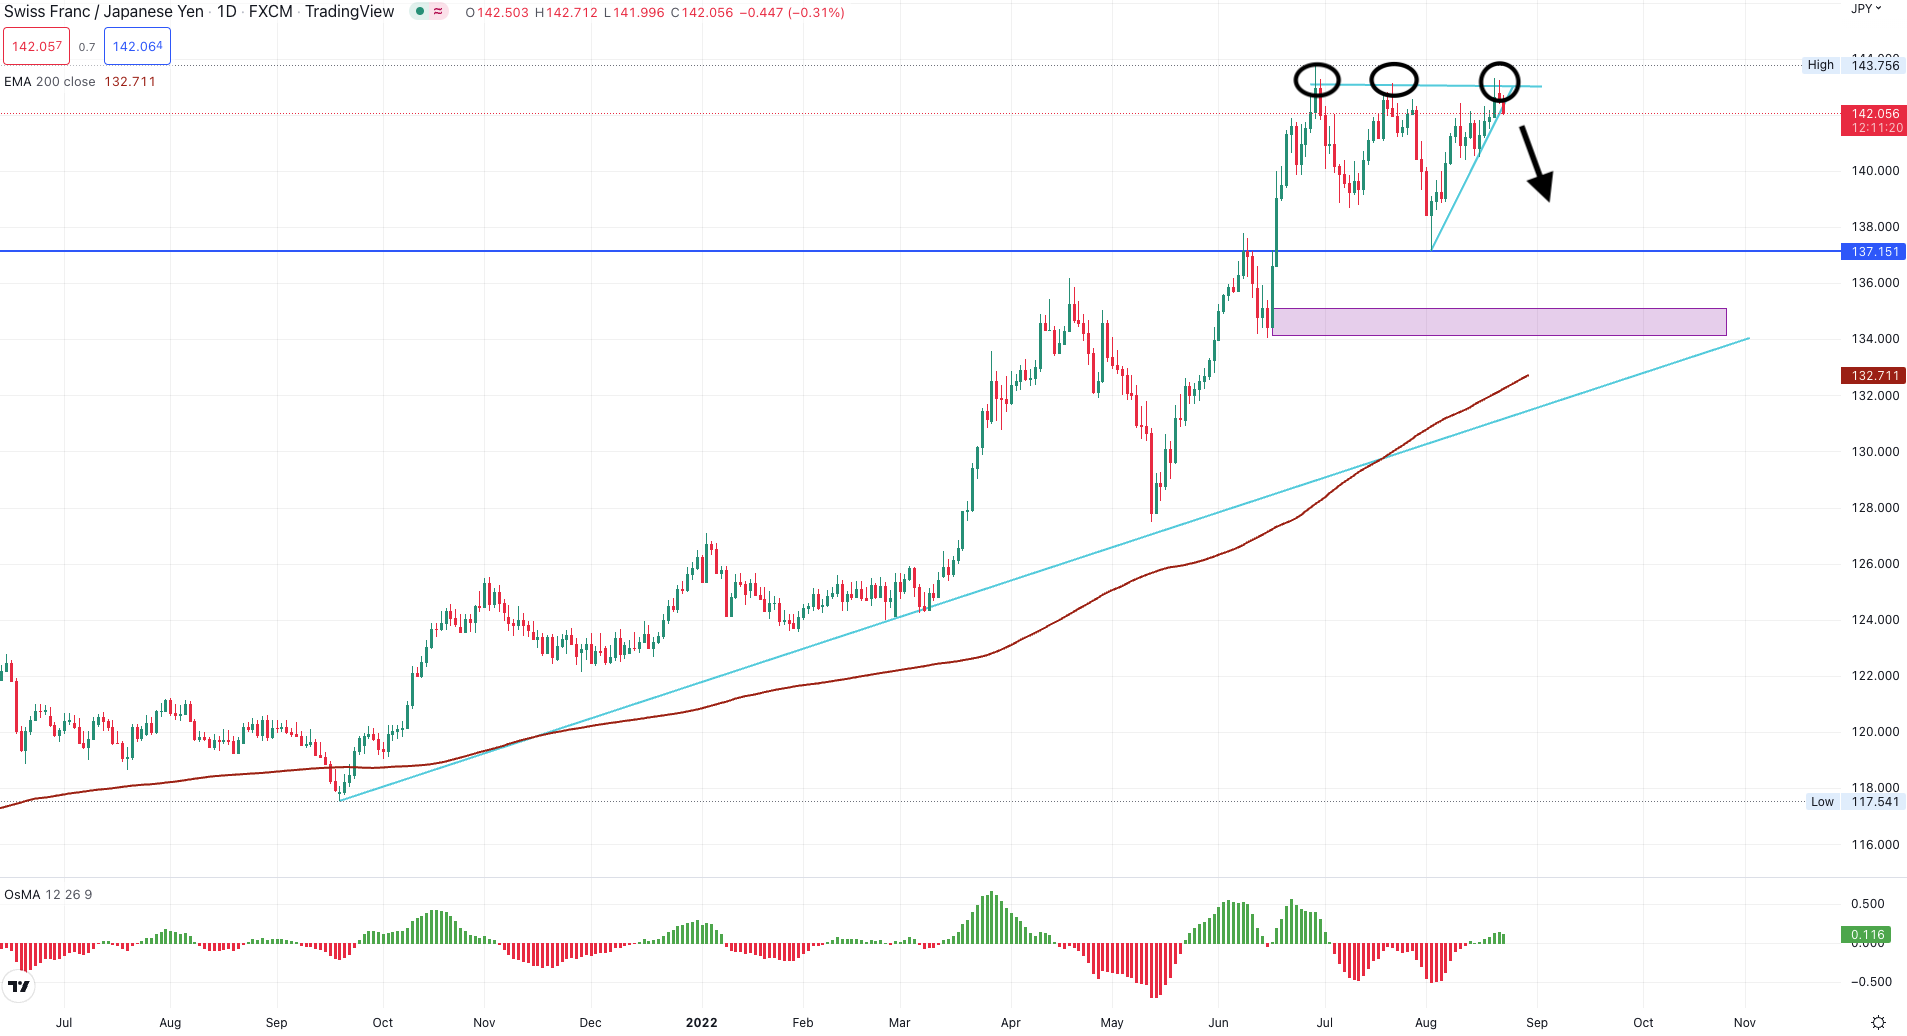
chfjpy daily chart, source: tradingview.com
EUR/NZD outlook
EUR/NZD basically moved sideways throughout the whole of 2022 and last year as well. However, this currency pair turned around pretty obviously at the end of June and fell by more than 1,000 pips. It is in a clear downtrend at the moment, and a bearish signal was just recently formed.
Related blog: Weekly macro report – European risks and opportunities
The easiest way to profit in markets is to join the trend. EUR/NZD filled the marked gap and created a slight divergence that suggests the downtrend might continue. A move to the crucial support 1.56 is very probable in the next few months.
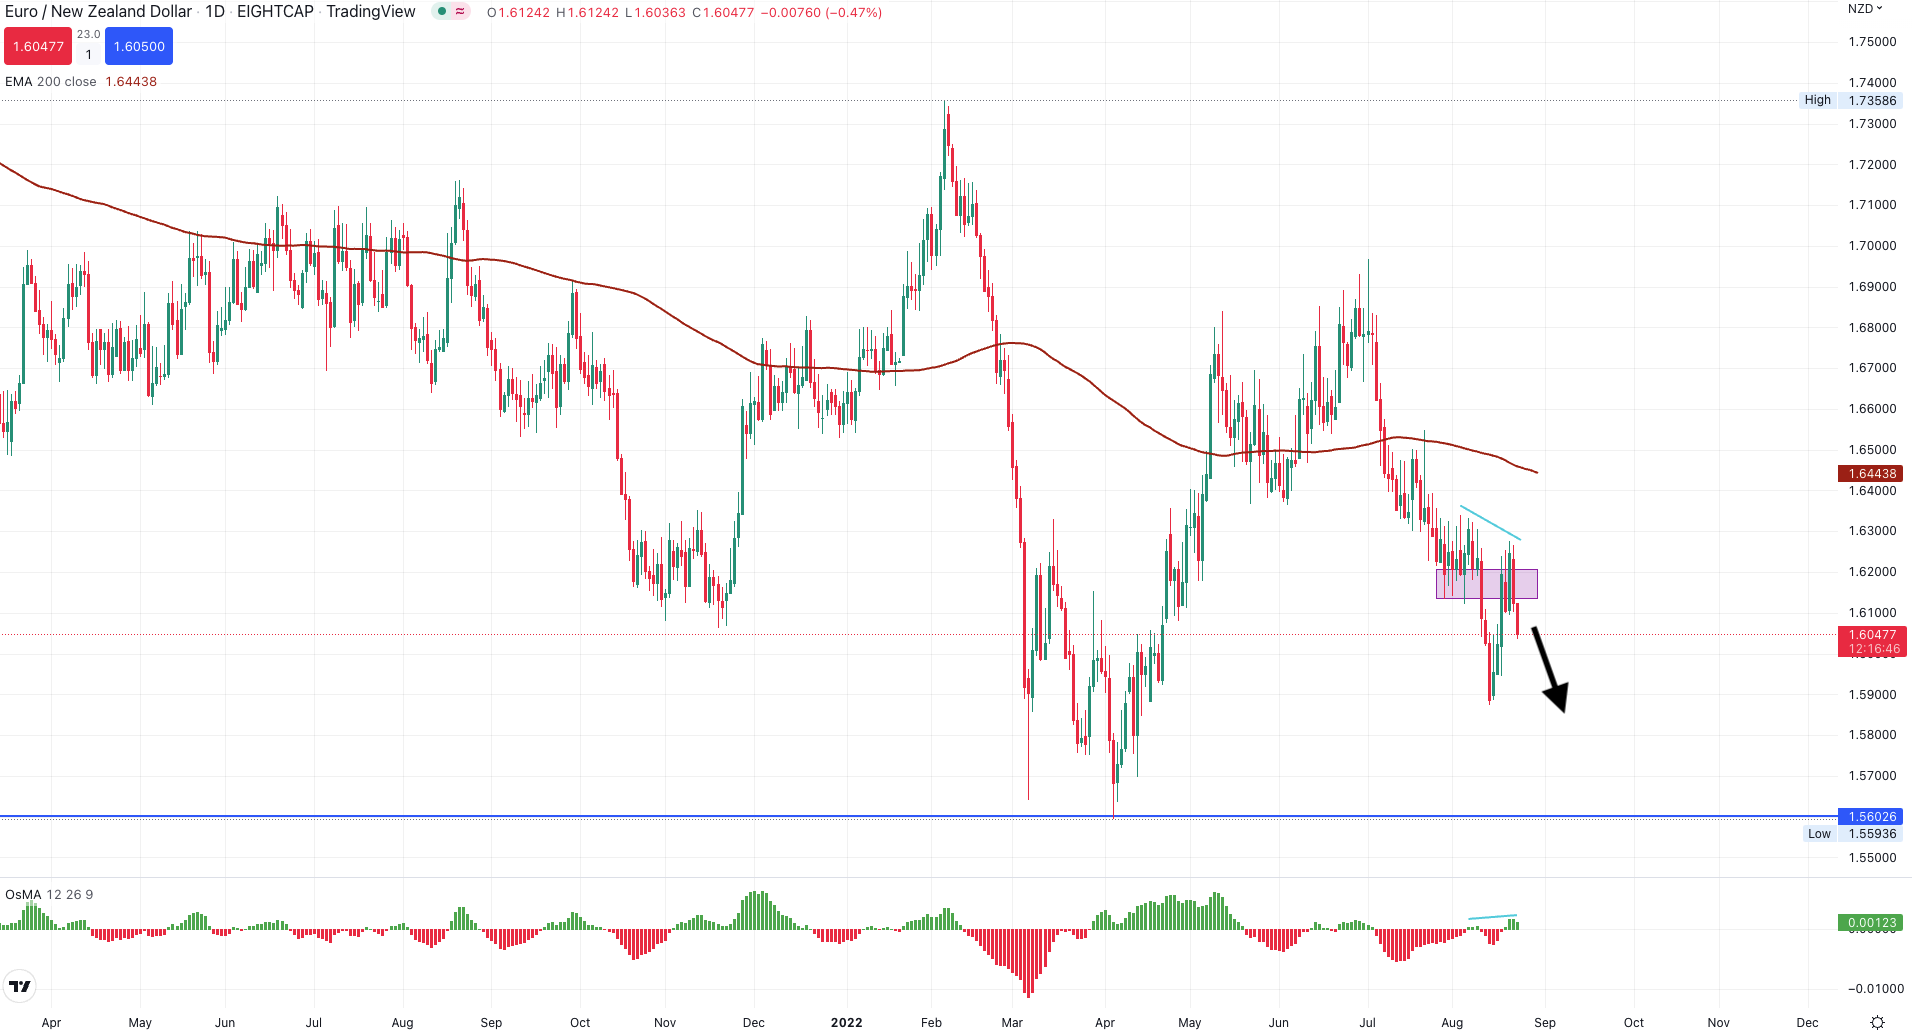
eurnzd daily chart, source: tradingview.com
Conclusion
When you look at charts from a technical perspective, do not forget markets are mainly fundamentally driven at the moment, and joining these trends is the way to profit with the highest probability.


Comments
Post has no comment yet.