The monetary policy strategy
The extreme volatility of the US dollar has been seen in the markets after Fed´s rate decision last Wednesday. Despite the fact that rates fulfilled the estimation, gold ended in red territory. But the end of the week was quite different. More insights and comments from Fed after the rate decision showed that higher hikes are not so definite in the future. To be clear, there is a high probability of lower hikes in interest rates in the future.
Read more: USD/TRY trades near record highs as inflation crisis worsens
The light touch of dovishness from comments after the rate decision poured optimism into the markets. Gold appreciated +3.30% on Friday and closed at $1685.7. It needs to be stated that the low of the price day before was $1618.3.
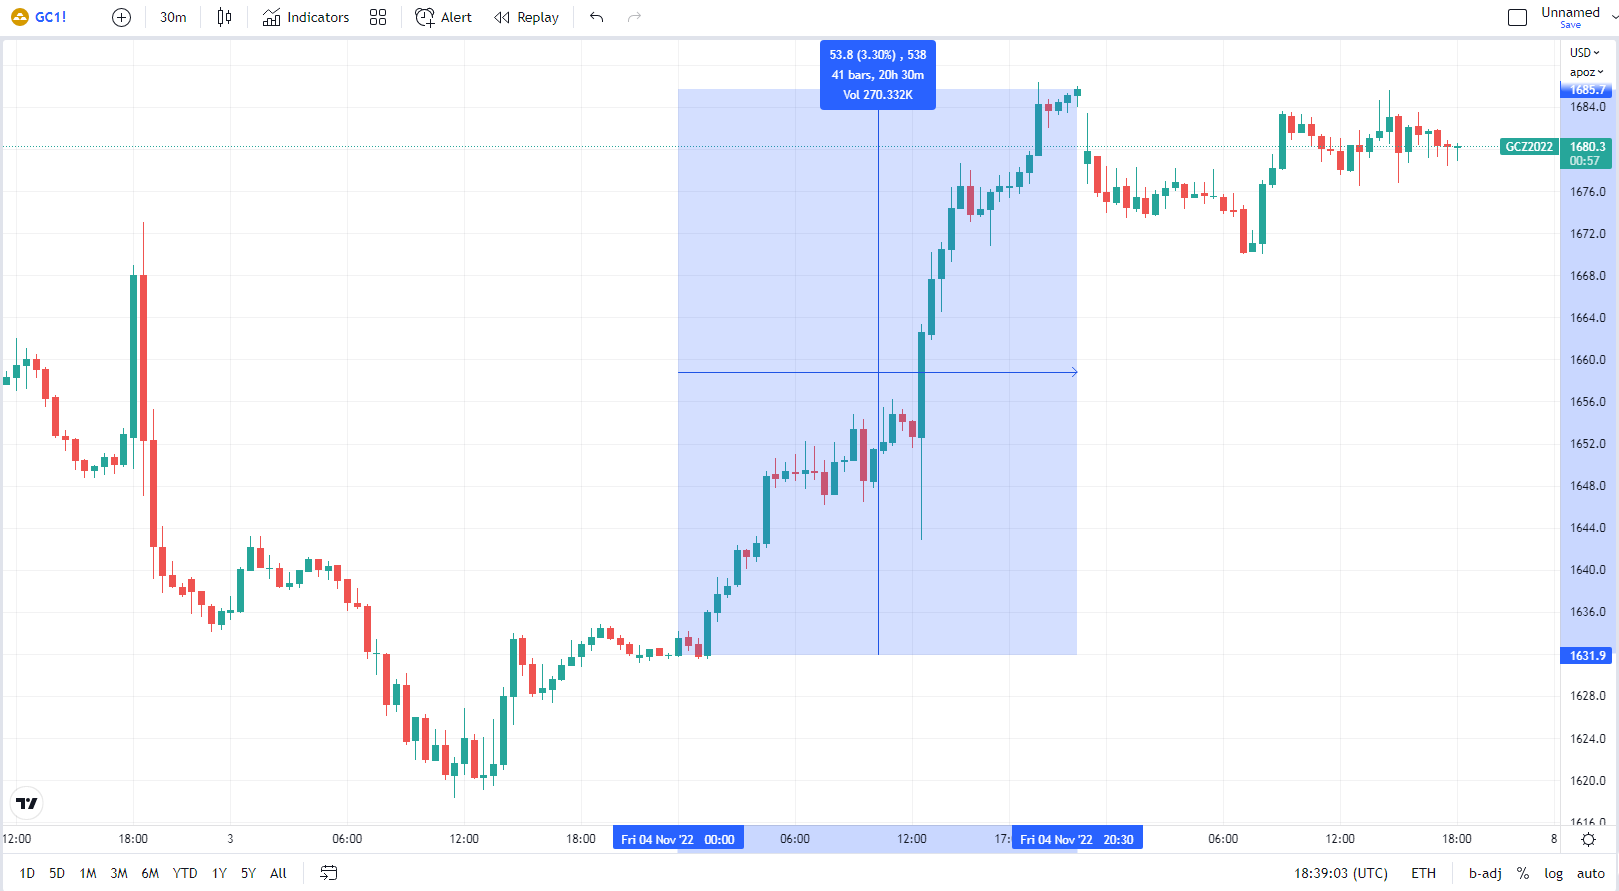
30 minutes chart of GC (Gold Futures), Gold’s appreciation on Friday. Source: tradingview.com
Volume levels of interest
Today gold holds gains from last week and is trading in a tight $15 range. Friday’s elevation left several potential support levels. The daily volume profile shows a significant support area from $1646.5 to $1654.4. This area is highlighted as a transparent rectangle with blue lines. It consists of a cumulated volume, where the profile has been created.
We analyzed also: US midterm elections – how can they affect markets?
Another support level is defined by the point of control from 3rd of November 2022 at the level of $1623.3 (a yellow dashed line). It represents the highest volume of the day, which is close to $1618.3, which is the low of the day. And the lowest price since April.
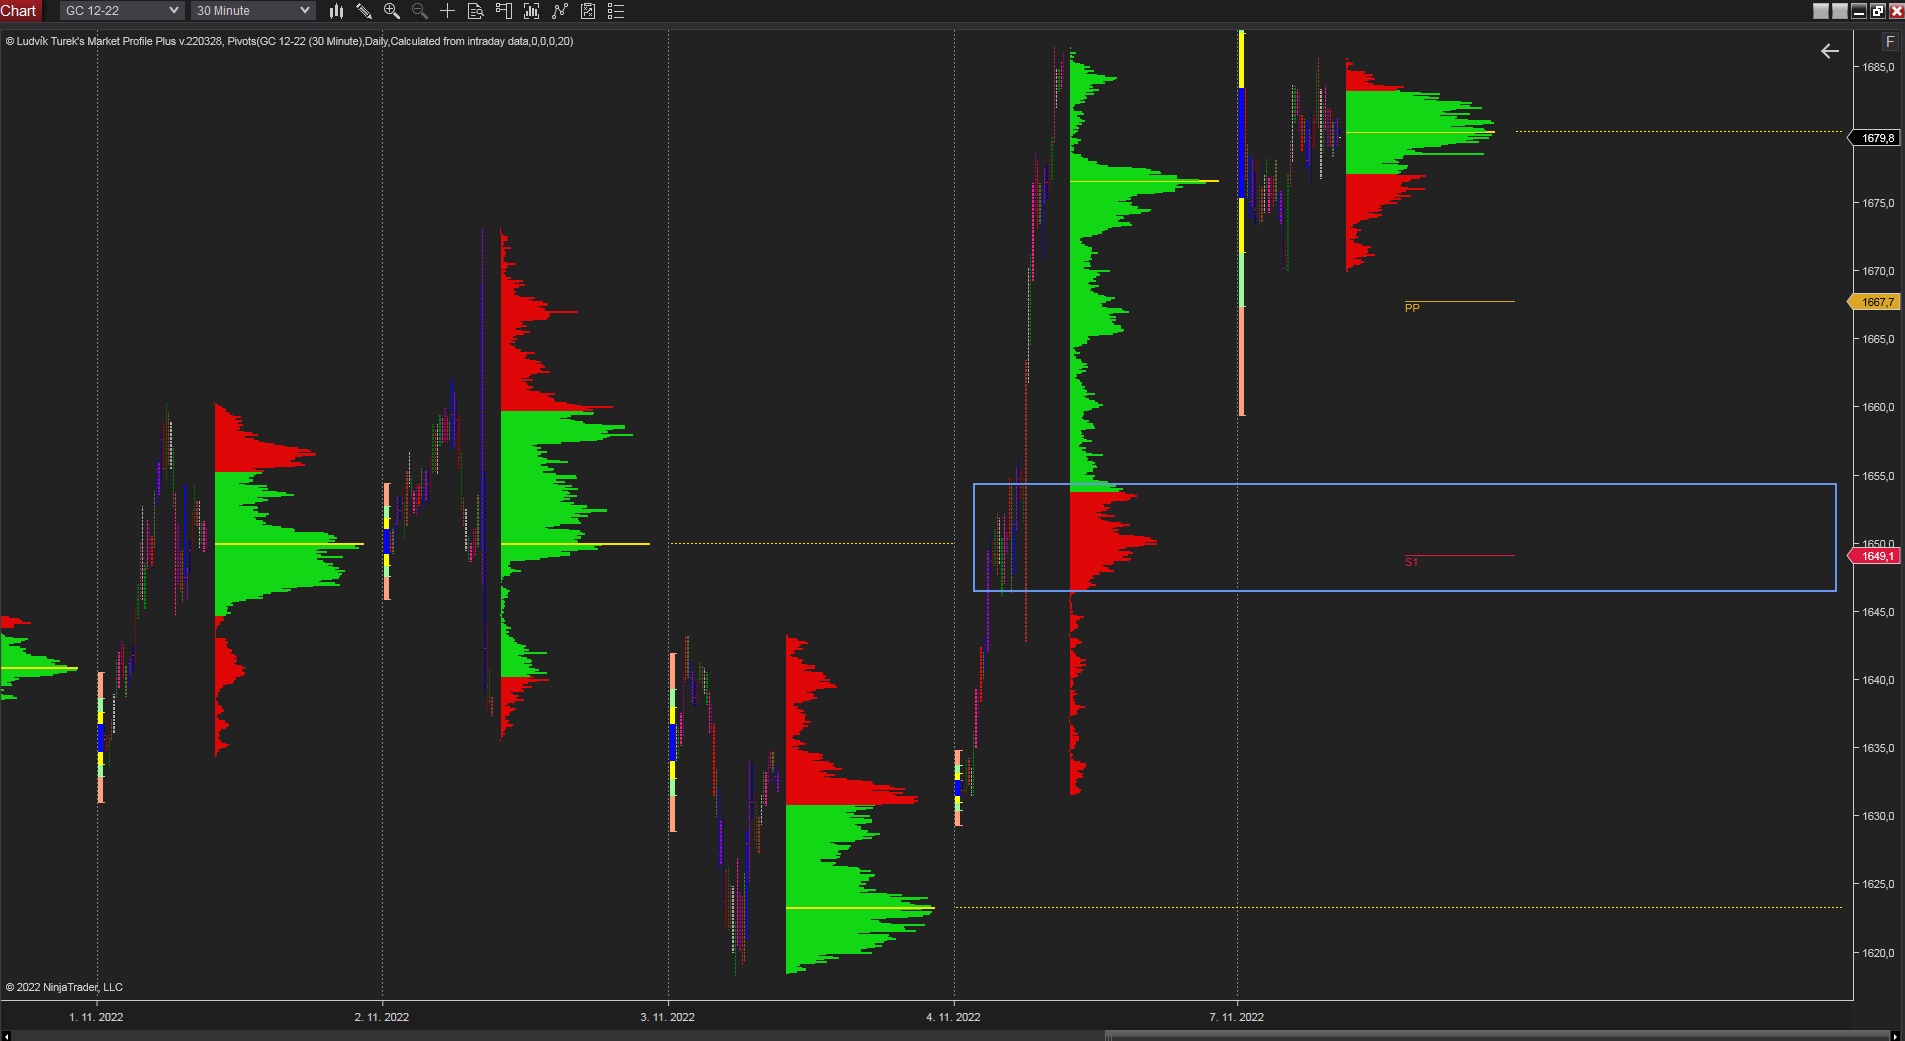
30 minutes chart of GC (Gold Futures). Daily market profile. Source: Author’s analysis
The US inflation data
All eyes are on Thursday’s US inflation data release. Inflation data are the most significant fundament in the setting of monetary policy. Any sign of the inflation peak can point to lower rate hikes, which could mean the continuation of the gold’s uptrend.
Therefore it is really complicated to set any potential resistance levels or areas. The current volatility of yellow precious metal indicates that any release from negative sentiment can elevate assets that are denominated in US dollars. The CPI (year on year) is estimated at 8%, with the core CPI at 6.5%. Lower than expected numbers could be a sign of culminating inflation and potentially the peak in inflation.


Comments
Post has no comment yet.