Fear over demand outlook
The price of crude oil is under immense pressure. Covid cases in China topped 23,000 thanks to a significant surge in major cities such as Guangzhou and Chongqing. In a time when some regions ease restrictions in zero-covid policy, big cities struggle to avoid outbreaks. The zero-covid policy is perceived negatively because it hurts potential demand for goods and services.
Read more: Is COIN ready to accelerate amid all the crypto chaos?
Additionally, JP Morgan projected a “mild recession” in the US for next year. They pointed out that the main accelerator is the interest-rate hikes by Fed. To be more specific, the financial institution projected more than 1 million job cuts. Moreover, if the inflation slows down enough, the Fed could start lowering the rates in 2024. This information shows another possible problem for the demand for crude oil.
Crude oil finds its support at $84
The current monetary policy of the Fed helps the US dollar to gain. The stronger dollar isn’t good news for the black commodity. The crude oil is down 6.04% this week, which is another red week. After the peak at the level of $93.74 from the previous Monday, the commodity is down -9.84%. Despite the disruption on the Druzhba pipeline, the flow has been restarted, and there was little price reaction.
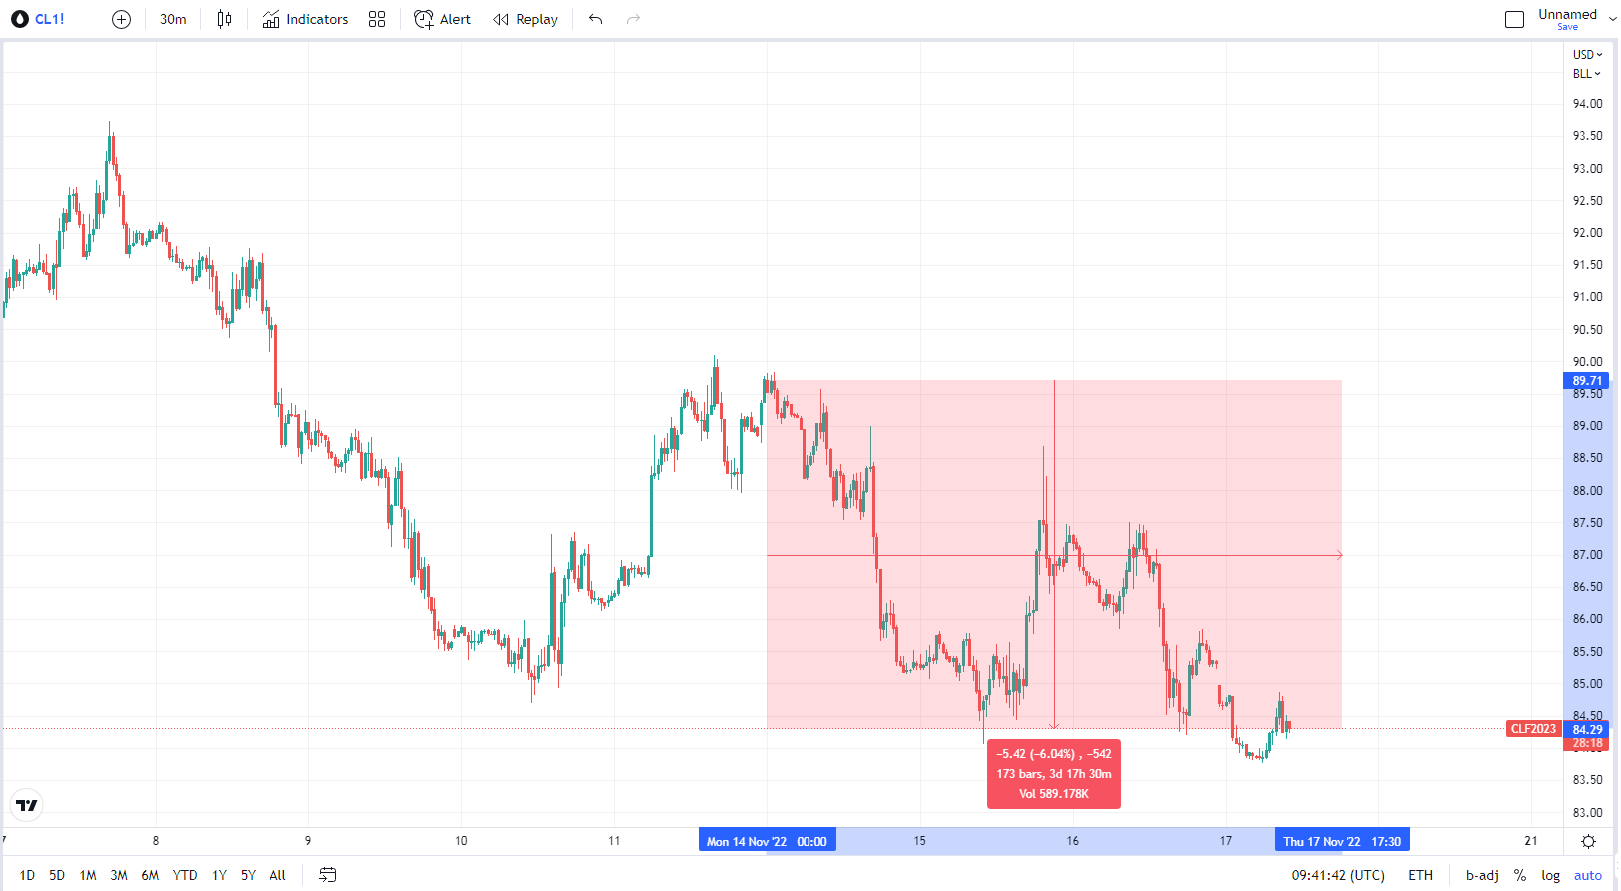
30 minutes chart of CL (Crude Oil Futures), Current week’s price development. Source: tradingview.com
The following chart shows that the price went under the volume-weighted average price of the last month. That means a significant resistance level at the level of $85.53. Additionally, price action shows that negative development stopped several times around the level of $84 (highlighted by white ellipses). This support has been effective for one week, and any break under this level can signal the continuation of negative price development.
Also read: Poland and Germany nationalize Gazprom’s domestic assets
Possible resistance could be seen at the level of $87.93. This level consists of the developing monthly VWAP (current month) and the highest traded volume in November. Volume is clearly seen in the histogram on the right side of the chart. To add, the price reacted numerous times to this level in the last 14 days.
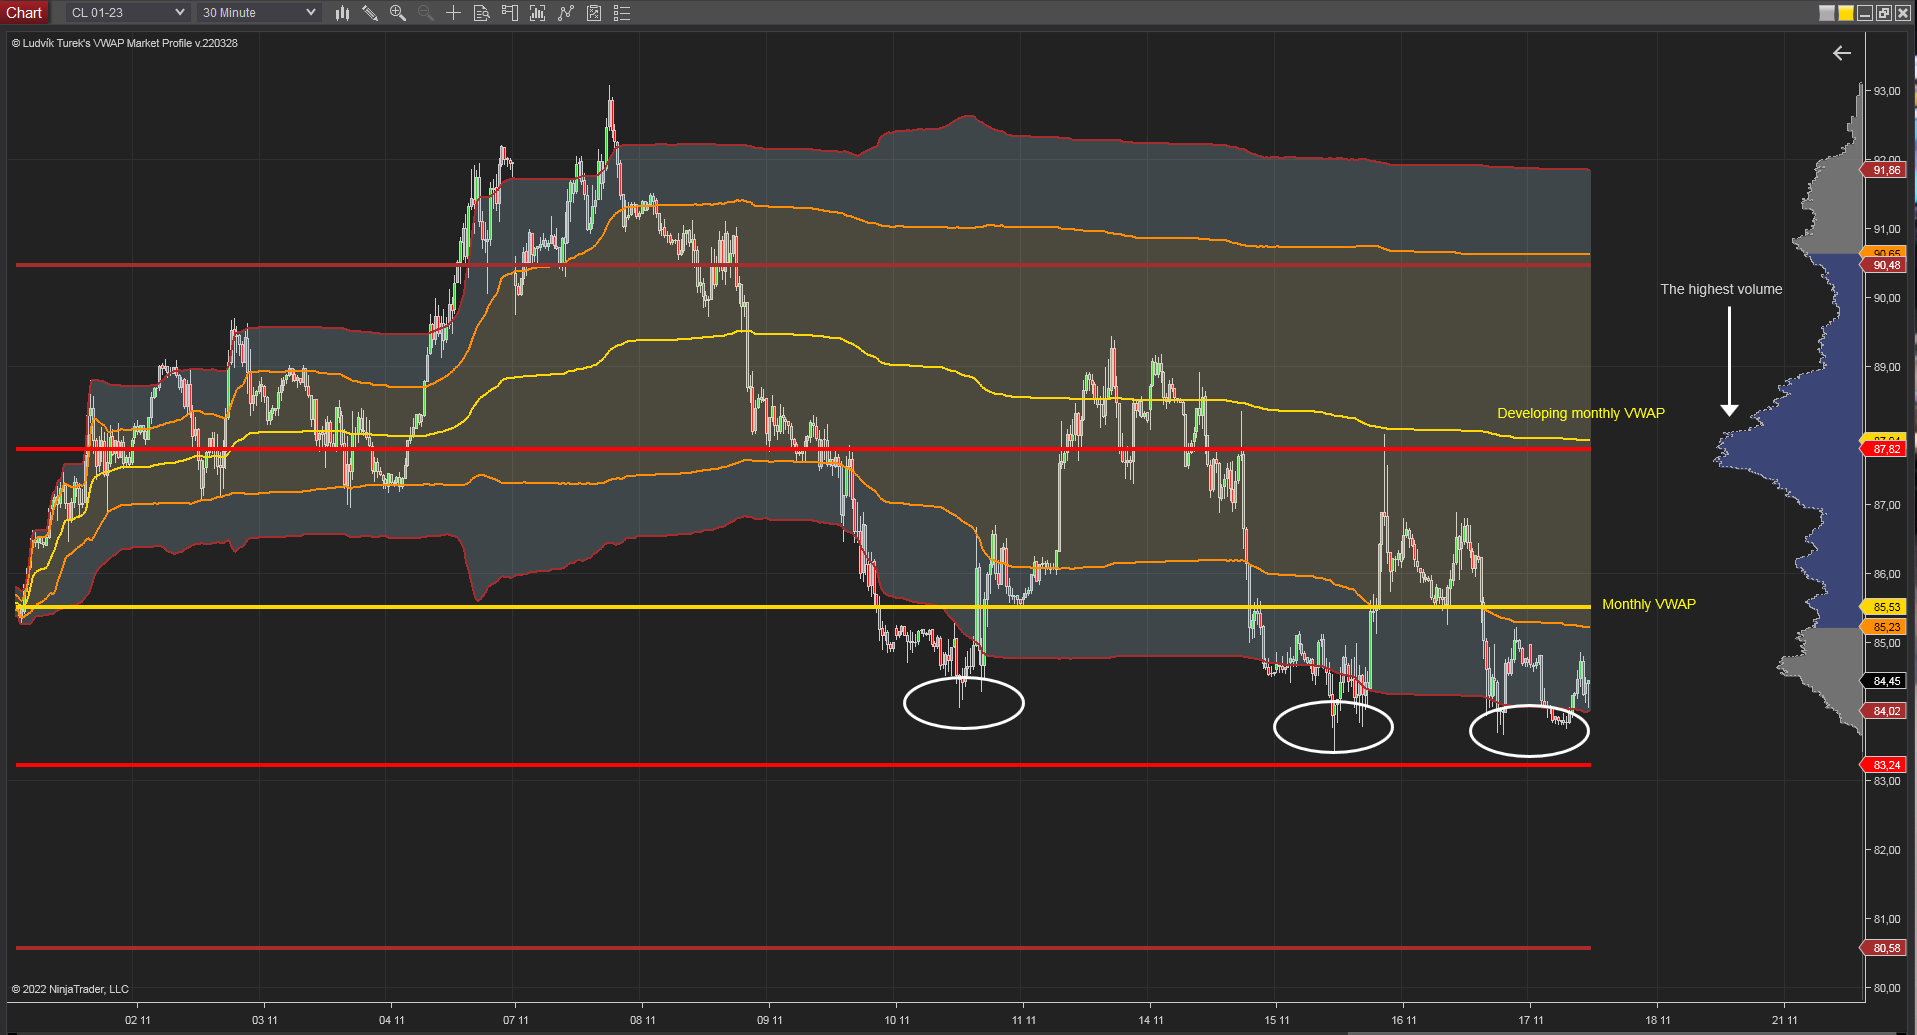
30 minutes chart of CL, Monthly Volume Weighted Average Price. Source: Author’s analysis
Crude oil is still in the bullish backwardation. That means that the current price of crude oil is higher than prices in the futures market. Backwardation occurs as a result of higher demand. The fear over lower demand is seen in the backwardation as well when the difference between the two nearest contracts on Brent narrowed from $1.86 at the beginning of the month to $1.19.


Comments
Post has no comment yet.