Inventories show weaker demand
Bloodbath in the markets with mineral oils seems to have no end, especially for crude oil, which is 4th day in continuous decline. The futures contract for West Texas Intermediate reached $72 per barrel. Today’s crude oil and gasoline inventories data from the US did not help as well. Crude oil inventories reached -5.187 million barrels, which is in comparison to the previous period with -12.58 million a lot worse. The stock change rose in the gasoline too. The current 5.32 million is higher than the expected 2.707 million, and the previous 2.769 million.
Read more: EUR/JPY on the crossroads – is a big move on the horizon?
What do these data actually mean? Simply put, the rising stockpile of certain commodity shows weaker demand. Crude oil and gasoline data from the US show, that the economic situation worsens. Demand for black commodity did not jump even though the zero-Covid policy in China has changed.
Volume on futures contracts
This month has started in red numbers and even the OPEC+ decision did not stop the current drop in prices. The chart below shows the accumulation of pivot lows and pivot highs. Pivot lows, the red arrows, were accumulated in quite massive numbers in the price range of $74 and $72. This situation can indicate a potentially higher number of limit orders on these levels – “retail stops”.
We analysed also: Gold remains under extreme short-term pressure
The accumulation of Pivot lows – a higher number of limit orders in a tight price range – can work as a magnet for price development. Especially in a situation when the price declines with almost zero volume, the traders are looking for a place where they can fulfill their orders. And accumulated limit orders in tight price range is that place. The accumulation is marked by a black ellipse.
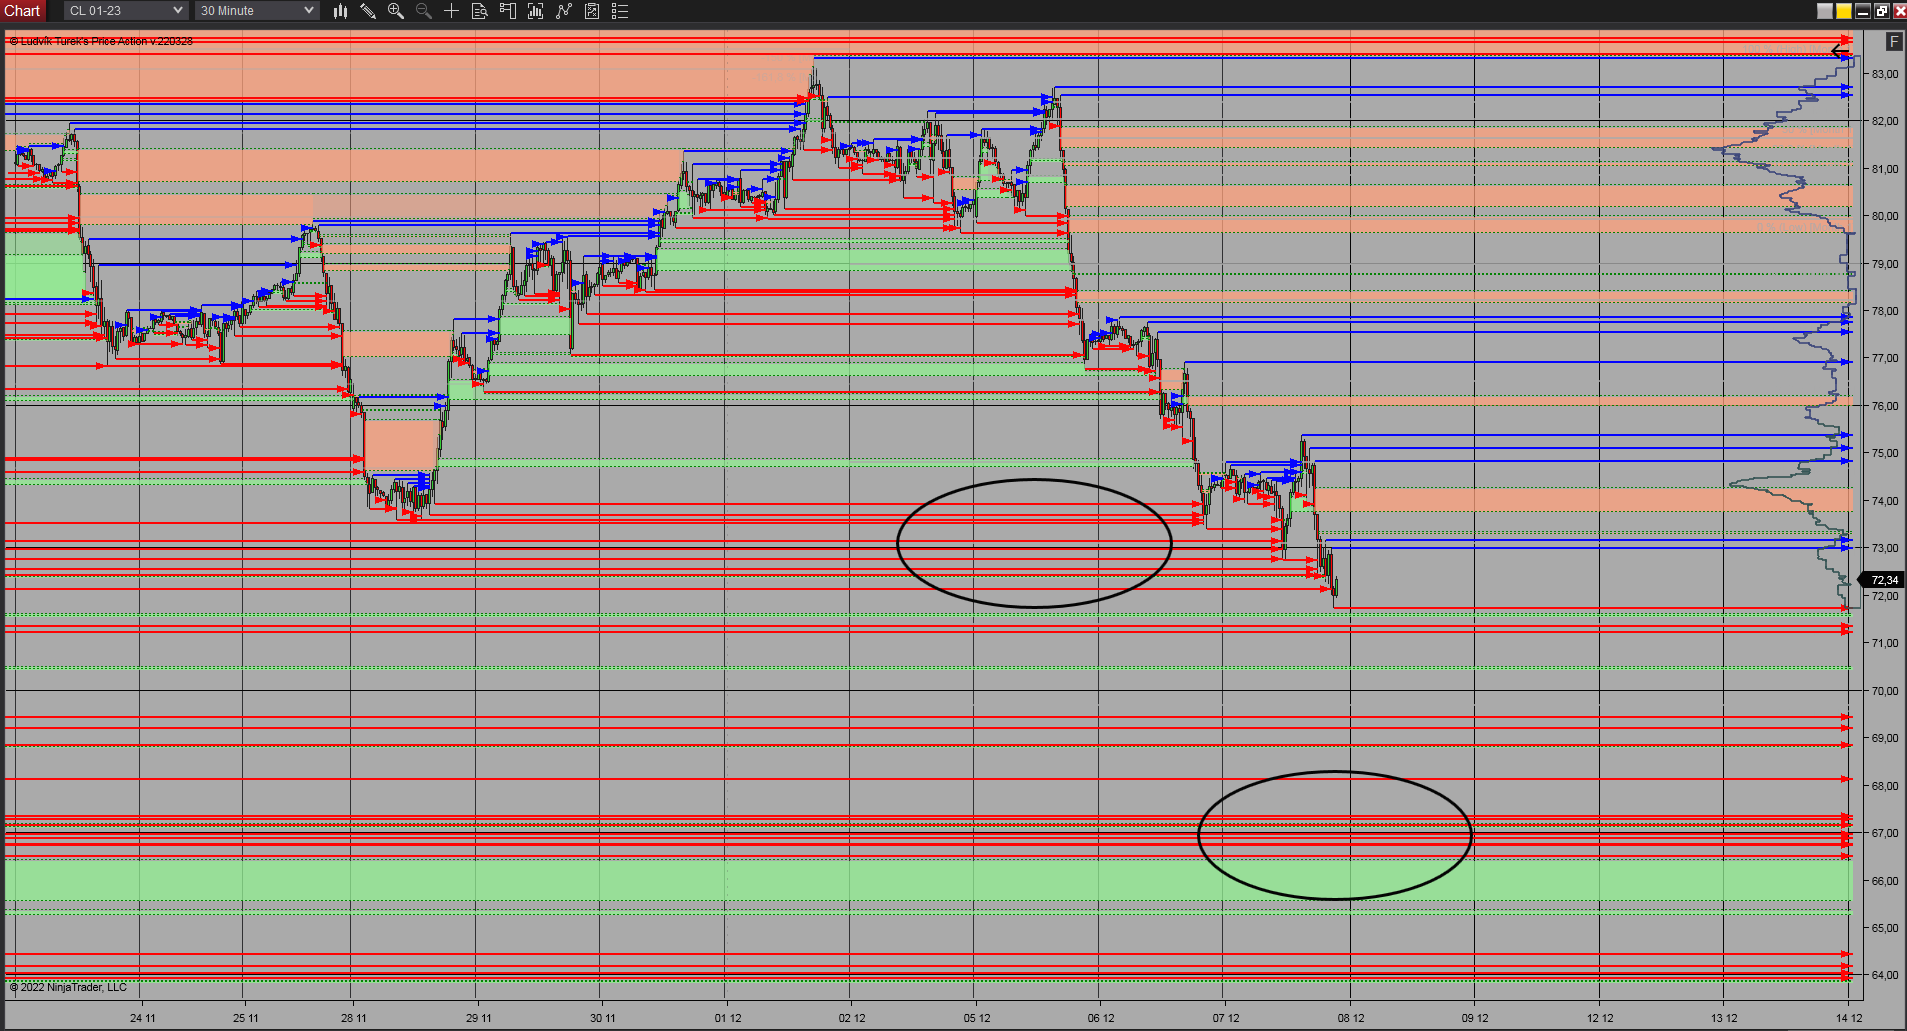
30 minutes chart of CL (Crude Oil futures), The accumulation of Pivot lows. Source: Author’s analysis
The current development of the price move shows, that today’s market fulfilled its hunger for volume, and reached the first accumulation. This is definitely seen at the right side of the chart, where the volume profile rises. But this situation does not have to be the end of the decline, because the next similar accumulation is at the level of $67, as the next support area for crude oil. On the other hand, if the price changes course, the closest possible resistance level can be around the level of $82, which represents the level from before the OPEC+ production cutback decision.


Comments
Post has no comment yet.