Looking at daily chart, I have been saying for a long period of time that we have not seen a proper retracement or lower high. But at the chart, there are two important levels that we need to take into account:
1.Level: 47 303 – 48 876 USDT
2.Level: 53 412 – 54 939 USDT
These two resistances are the toughest to break. Is thus the chance of BTC going below 30 000 USD over? I cannot rule it out completely. If we look at the dynamics of the downtrend and the uptrend, it is very visible what was more powerful.
Read more: EUR/AUD stays near 5-yr lows
What’s more, we have not been able to overcome any important level. I thus think, it is still possible to dip below 30 000 USD in the coming months. When we consider the volumes and liquidity, Bitcoin has come to test the liquidity level of 47 000 – 48 000 dollars. This could have been expected for quite some time.
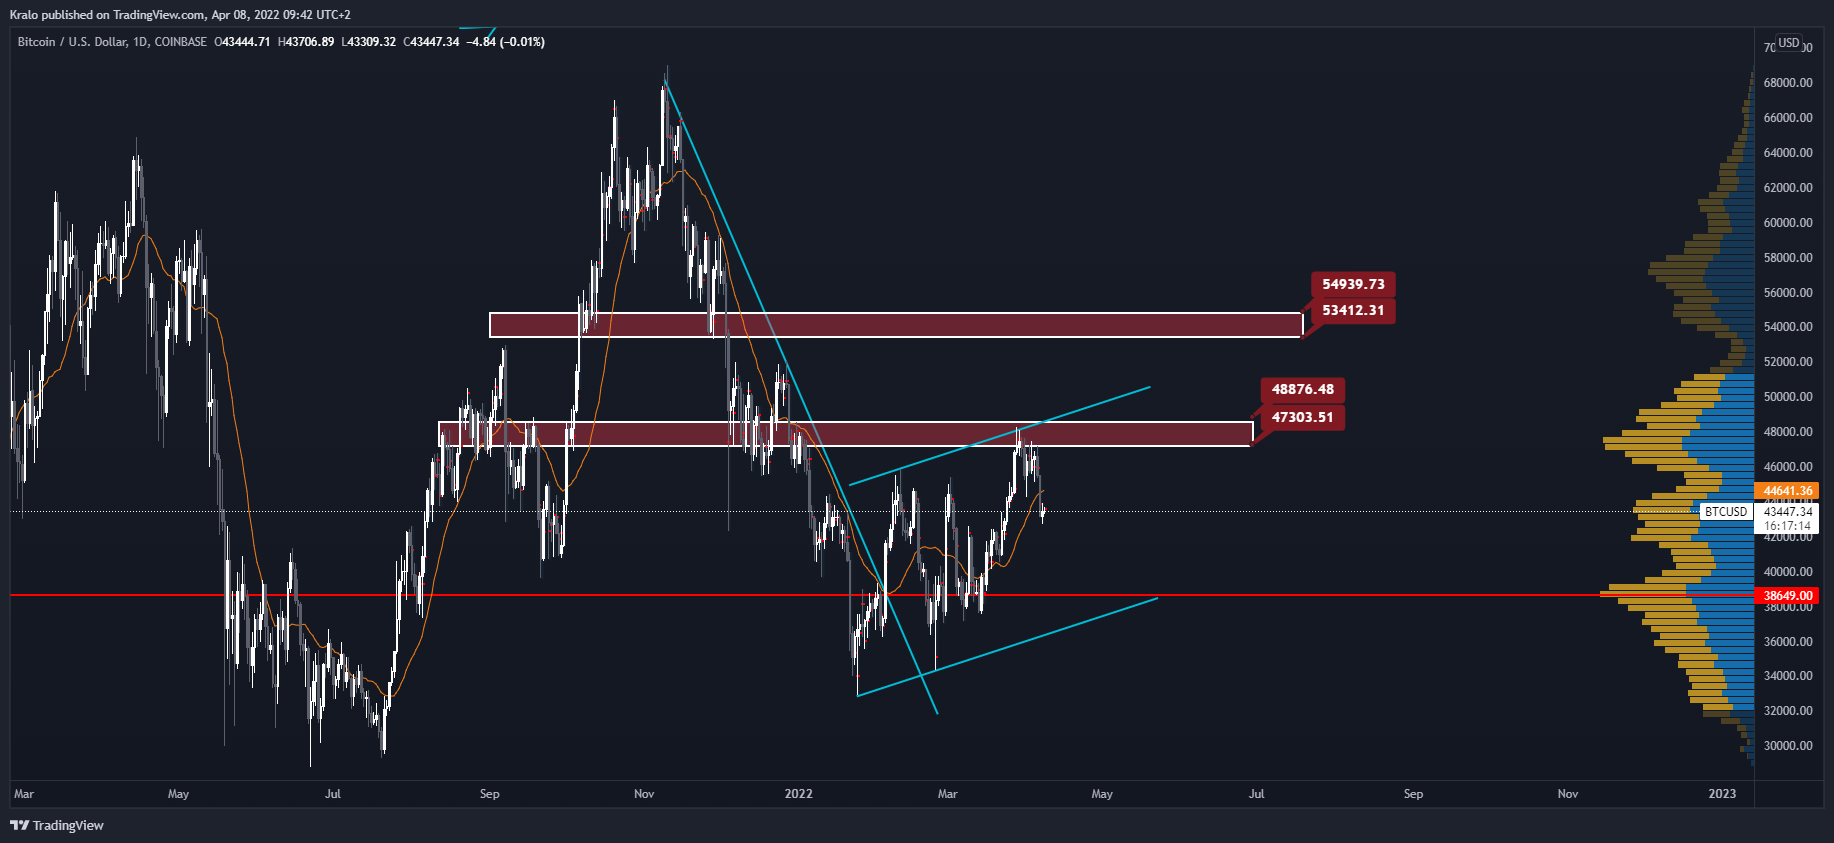
Bitcoin 1D chart, Source: Author’s analysis, tradingview.com
The fact that there is still ongoing war at Ukraine and Fed enters the market almost every month, I am not really concerned about long term outlooks, because the situation is changing very frequently. That is why I am not trying to come to any conclusions on where Bitcoin can go.
What can we see at 4-hour chart?
Considering everything that is going on in the world (war, inflation, pandemic, interest rate hikes), I am always only looking at the upcoming moves. That is mostly due to the fact that the situation in the world is changing constantly, thus thinking about long term movements makes no sense.
As of now, I would be primarily looking at the retracement to the level of 41 785 – 42 389 USDT. This will be the level where I might expect reversal, or where at least I would get more cautious. Until then I will be short.

Bitcoin 4-hour chart, Source: Author’s analysis, tradingview.com


Comments