Market profile
Gold stays in the side-trend after Fed’s data. Even a more significant hike than expected did not move with the gold price. This non-trend situation is one month long and is continuing, for now. We wrote about it here or here. It is not very clear what the next gold’s manoeuvre will be. Side-move brings many levels of interest. To put simply, trading volume is rising and therefore higher volume on specific prices shows possible interest levels. In the chart below is shown the market profile indicator. Support is set at 1832.5$ and the resistance is at level 1849$.
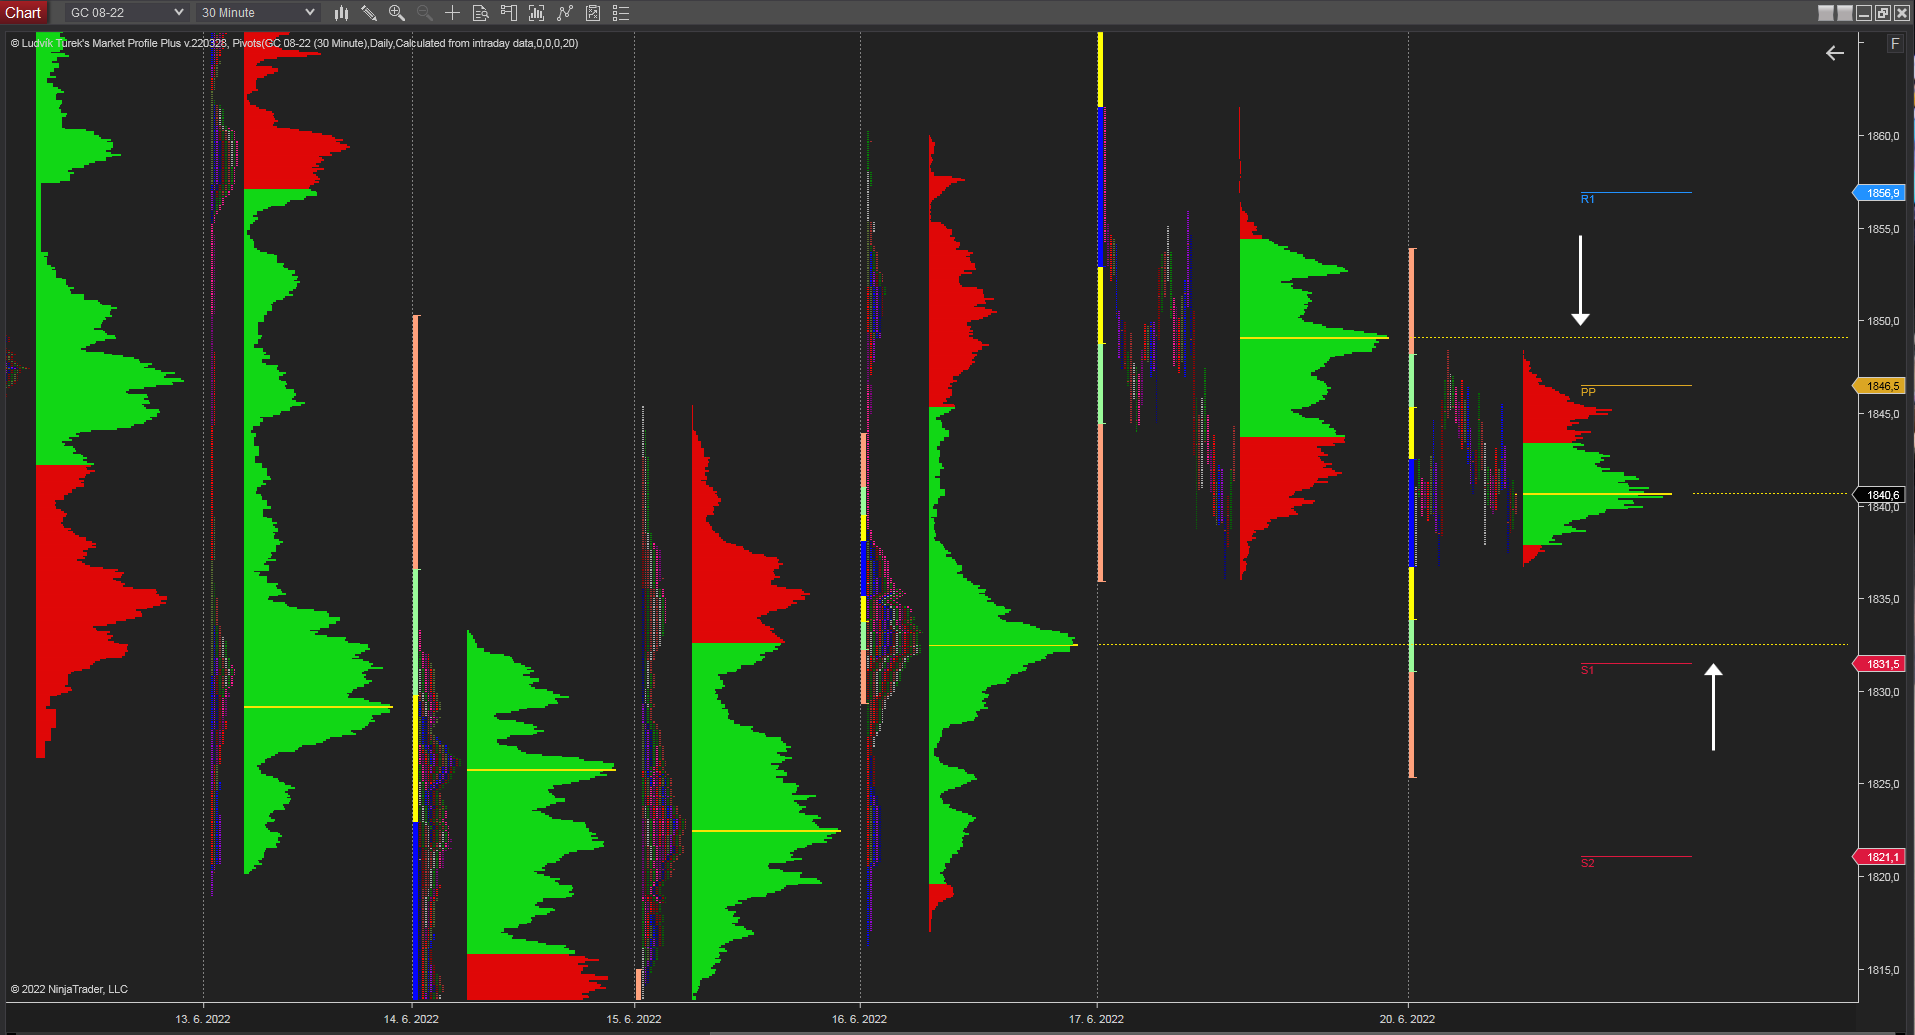
30 minutes chart of GC (Gold Futures), Market profile indicator. Source: Author’s analysis
Monthly VWAP
The monthly volume-weighted average price indicator shows that the level 1855.8$ still works. This means that after Fed’s monetary decision price elevated up and mentioned level worked as resistance (the last two blue circles). Moreover, developing VWAP of this month lays on 1844.8$, and it has seen price reaction around this level. Support could be set by 1st standard deviation of last month (solid red line) at 1830.6$ and developing 1st standard deviation (orange solid line) at 1829.5$.
Read more about: The US housing market is going through tough times
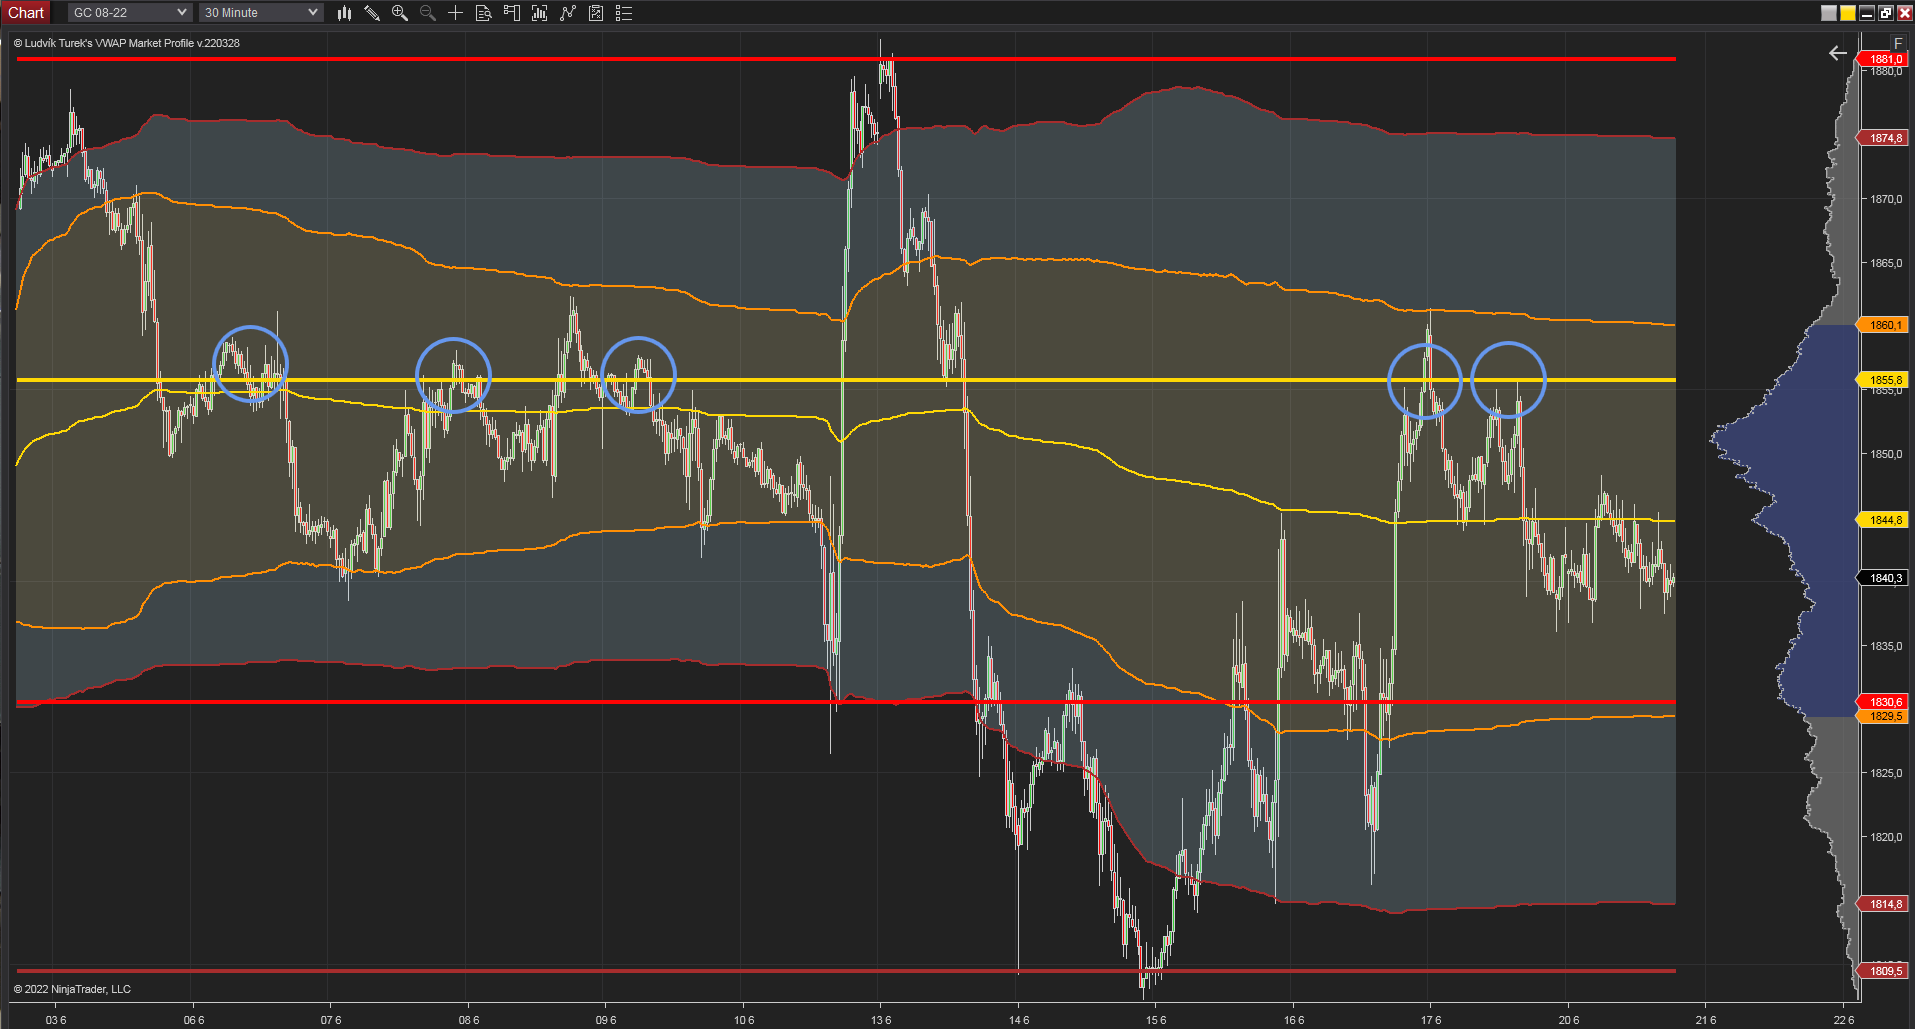
30 minutes chart of GC, Monthly VWAP indicator. Source: Author’s analysis
Pivot highs and pivot lows
Pivot highs and pivot lows draw a line after a specific price action setup which depicts highs and lows at the chart. This does not sound very interesting, but the attention should come to the case where these levels are accumulated in a very tight range. And this accumulation could set support and resistance levels. In the chart below, we can clearly see pivot highs (blue lines) which are accumulated around level 1846$. This could be a possible resistance level. In addition, pivot lows (red lines) are accumulated in range 1808$ – 1814$. This could be defined as a support area.
You may be also interested in: AT&T and Verizon postpone the use of some 5G bands
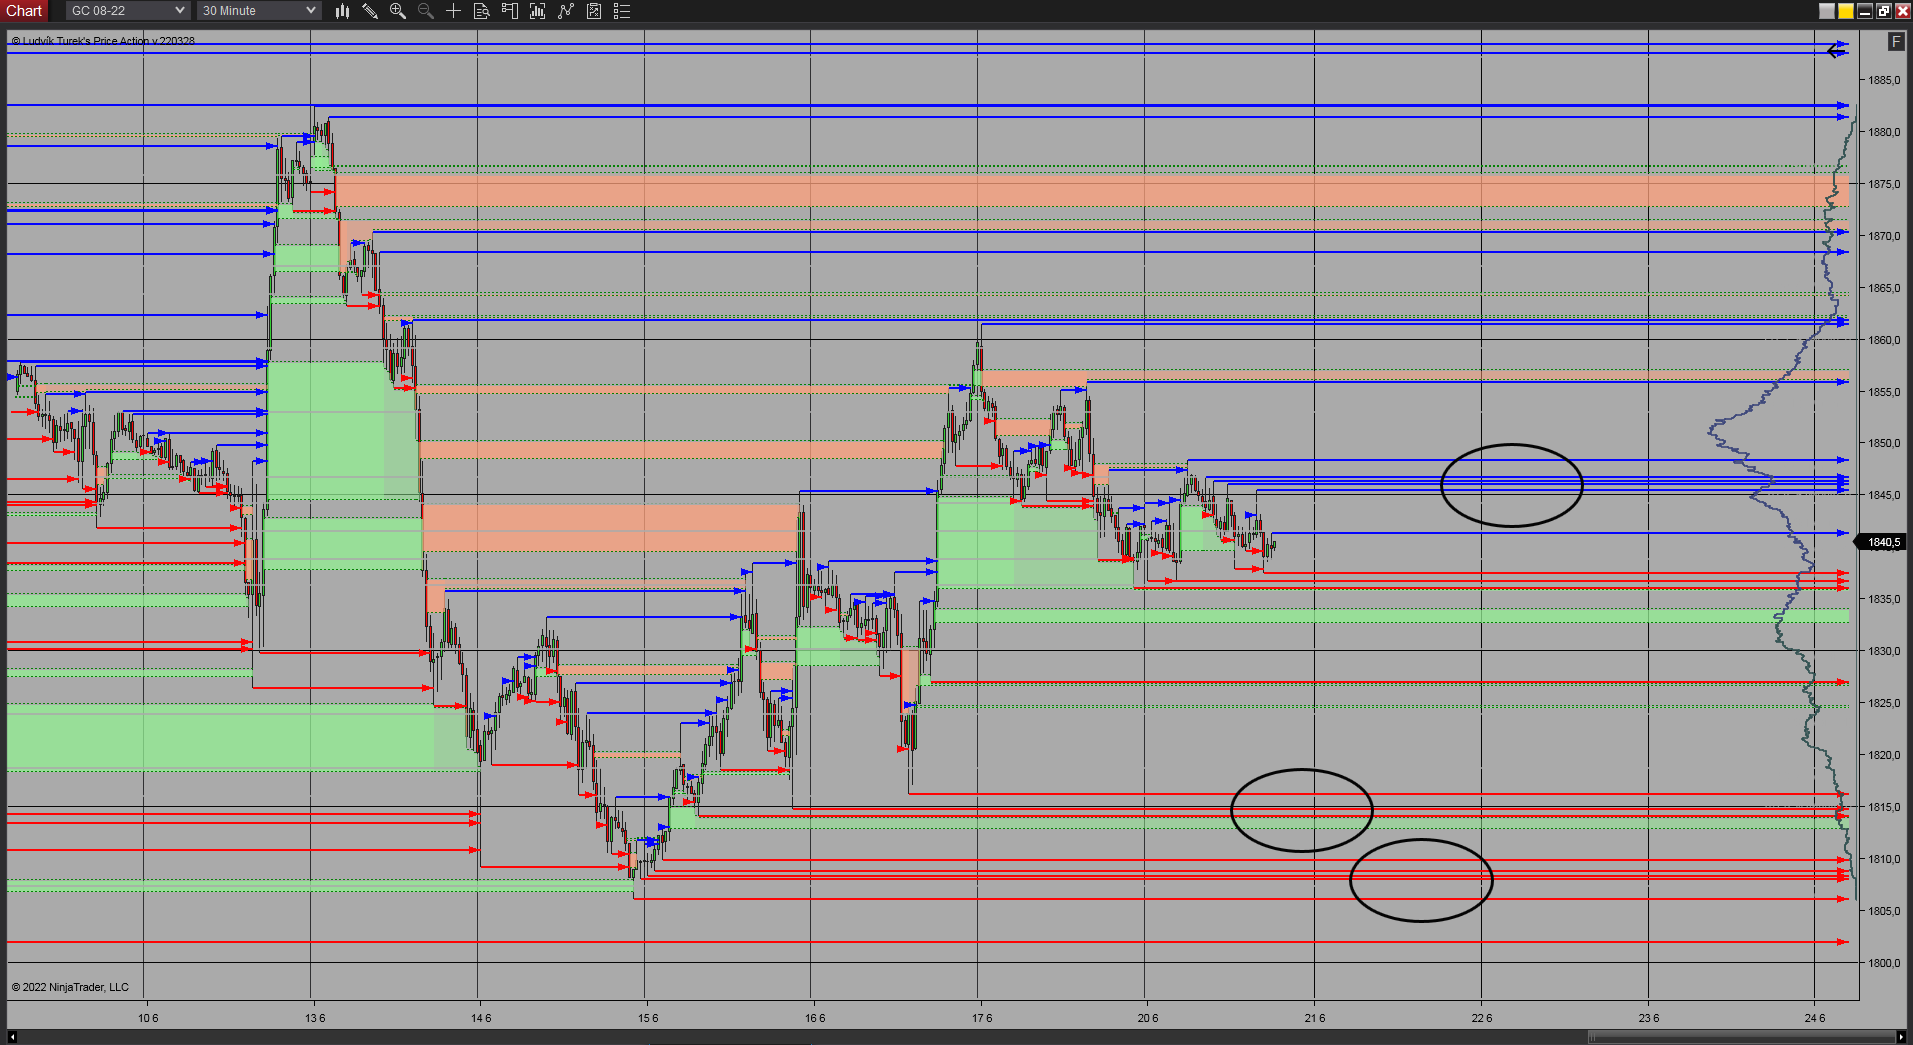
30 minutes chart of GC, Price action indicator. Source: Author’s analysis
Summary
In summary, we can say that supports are set around level 1830$ and another level is around 1811$. On the other hand, resistance levels accumulate around 1845$ and 1850$ price tags. To add, monthly volume, which represents the highest traded volume of this month is at 1851$. This underlines the previously mentioned resistance levels.


Comments
Post has no comment yet.