All eyes on Fed
This Wednesday will be the center of traders’ and investors’ universe. Fed’s rate decision is highly awaited. There are several reasons why this week’s decision is so highly expected. Firstly, the consensus for interest rate hike is 75 bps. This number was mentioned several times by analysts and Fed officials. Therefore the reaction has been numbered in the price of gold. The yellow metal reacted negatively and the bear movement persisted.
Related: S&P 500 drops like a rock after US inflation
But last week’s inflation data made significant eruptions throughout exchanges, where year-to-year and month-to-month inflation and core inflation exceeded the consensus. And this situation has rapidly changed the outlook at the current stage of monetary policy. Especially in the size of the hike. A 100 bps hike can be back on the table. Markets reacted negatively alongside with the gold. Immediately after data revelation, gold depreciated by 2%, but the low reached the level of $1661.9 (GC Futures), which represents -4.58%.
Levels of interest
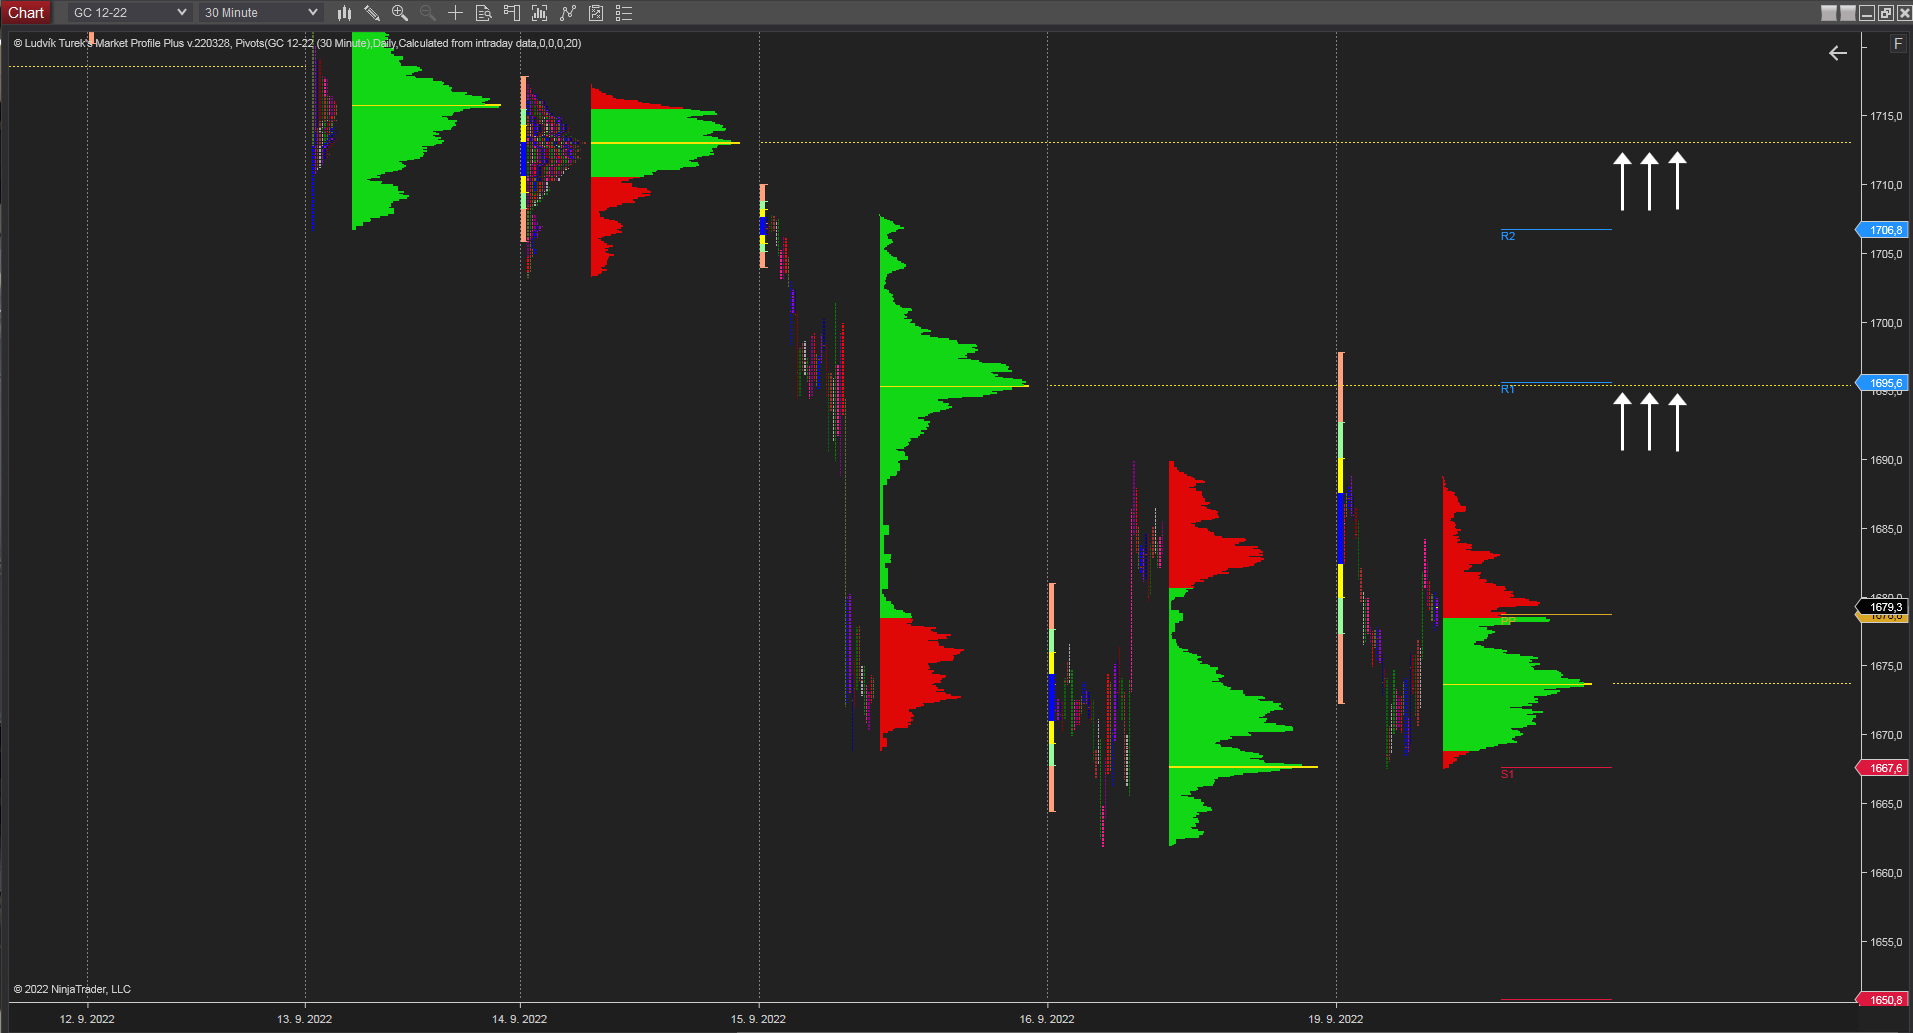
It could be tricky to look at levels of interest which represent supports or resistances, but volume can point out an area with the most trades and orders. And these levels/areas could work as potential helpers. Despite this, the most important is rate decision and press conference. Futures volume shows several levels of interest. Gold is actually in the bear territory. The daily market profile shows potential resistance areas at $1695.6 and $1713.2, which are made by POC (point of control – the highest traded volume of the session) from the 15th and 14th of September.

30 minutes chart of GC (Gold Futures), Daily Market Profile’s levels of interest. Source: Author’s analysis
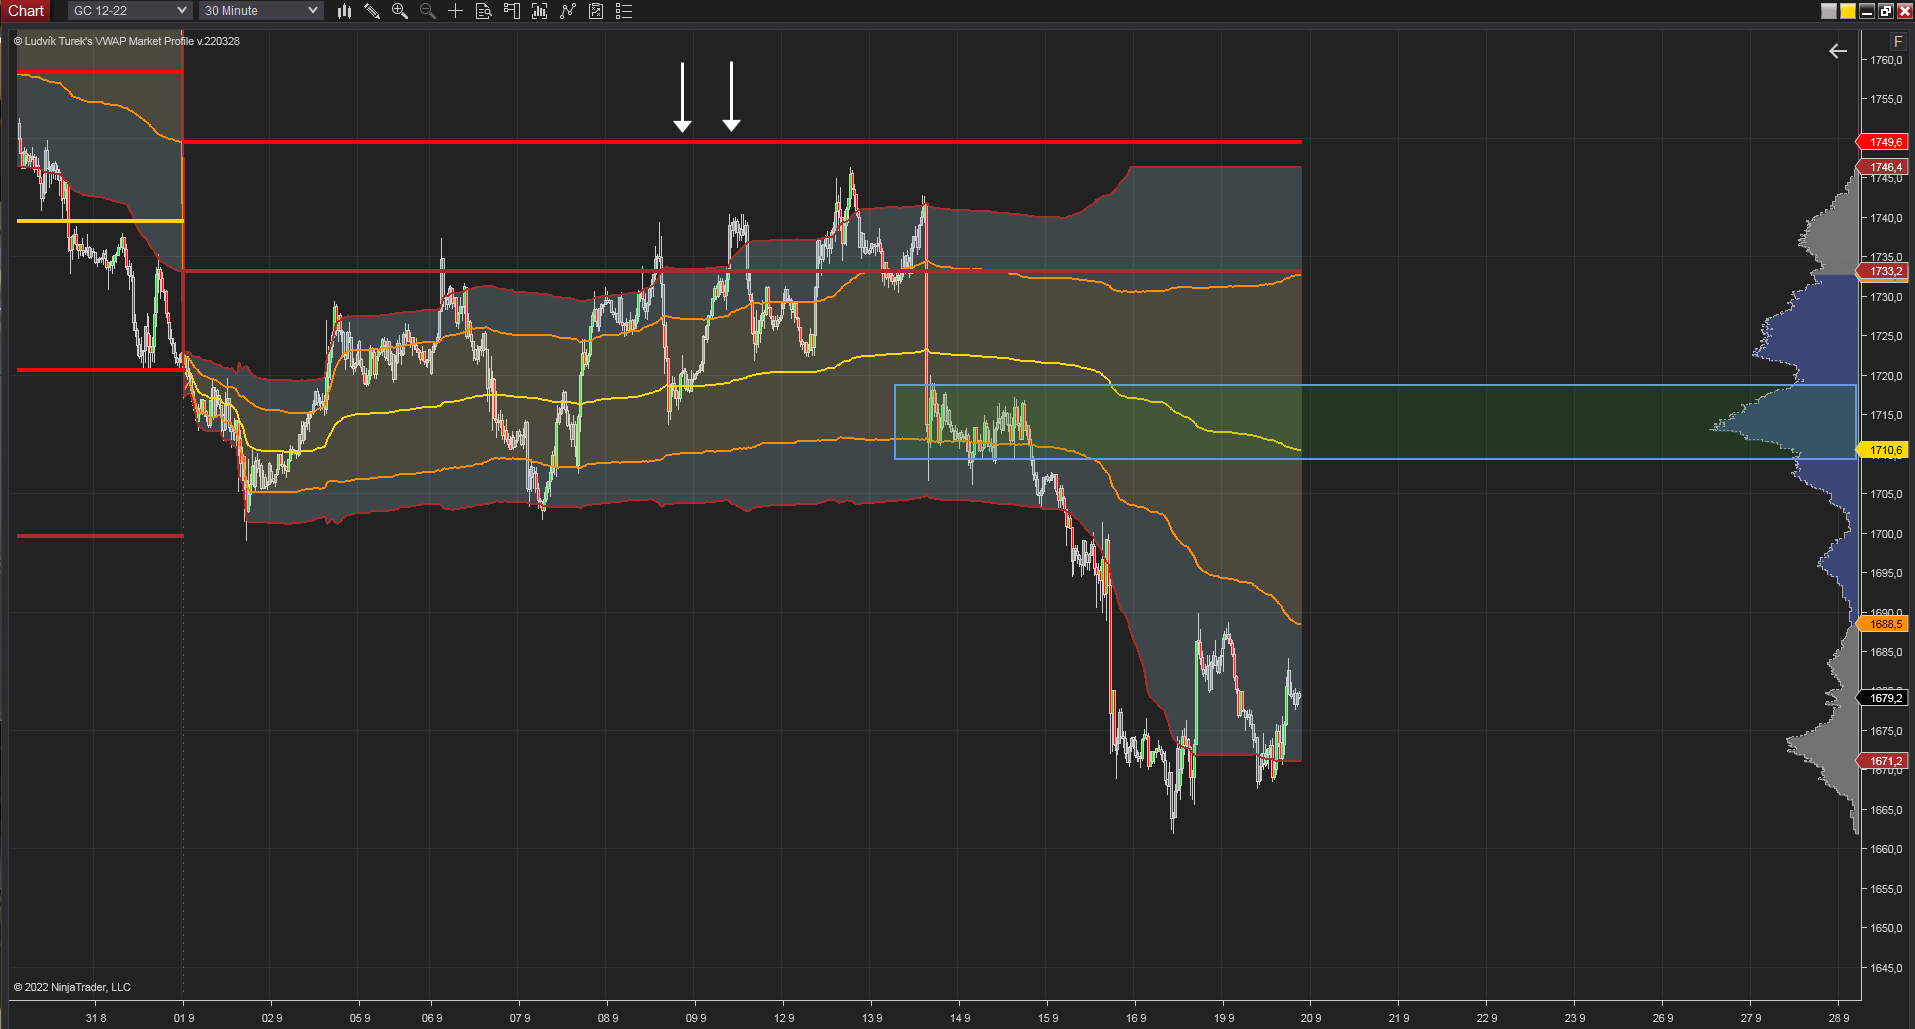
Monthly VWAP (Volume Weighted Average Price) shows developing POC (yellow line) at $1710.6. Moreover, the histogram on the right shows the highest volume of the session in the area from $1709-$1719 (green rectangle). In the current situation, finding support for gold could be hard. There are no data from at least one year, under the low from the 16th of September. The possible market reaction to a 100 bps rate hike is therefore unpredictable.
Read more about: GBP/USD plunges to nearly four-decade lows

30 minutes chart of GC. Monthly VWAP. Source: Author’s analysis
Inflation vs. Interest rate vs. Gold
There is a simple equation where higher inflation = higher interest rates = negative impact on gold. Why there is a negative impact? Gold is a non-interest financial asset. That means gold is less competitive with the assets with rising interest. Even in times of risk-off sentiment, gold predominantly depreciates. And current inflation data overplays bullish looks on the yellow asset. All eyes are on Fed’s decision, where a higher number than the consensus could spark another selloff in the market with precious metals.


Comments
Post has no comment yet.