A month long trend
Downtrend on gold has been clearly visible exactly one month. It has started on 18th of April and the first serious break of the trend was on the 17th of May. Decline of yellow metal has been caused by fundamentals such as monetary politics and pressure from Fed on the markets via rising interest rates. In addition, rising treasury yields have negative impact on gold as well.
We have informed about this topic: Gold is in decline for a month
As we mentioned in the previous article, divergence between delta and the price move showed possible disruption in the trend. After this disruption, price went up and made higher high and higher low (marked by 1H and 1L). Downtrend can be defined as creating lower highs and lower lows. And higher high and low could be one of the basic patterns for trend disruption.
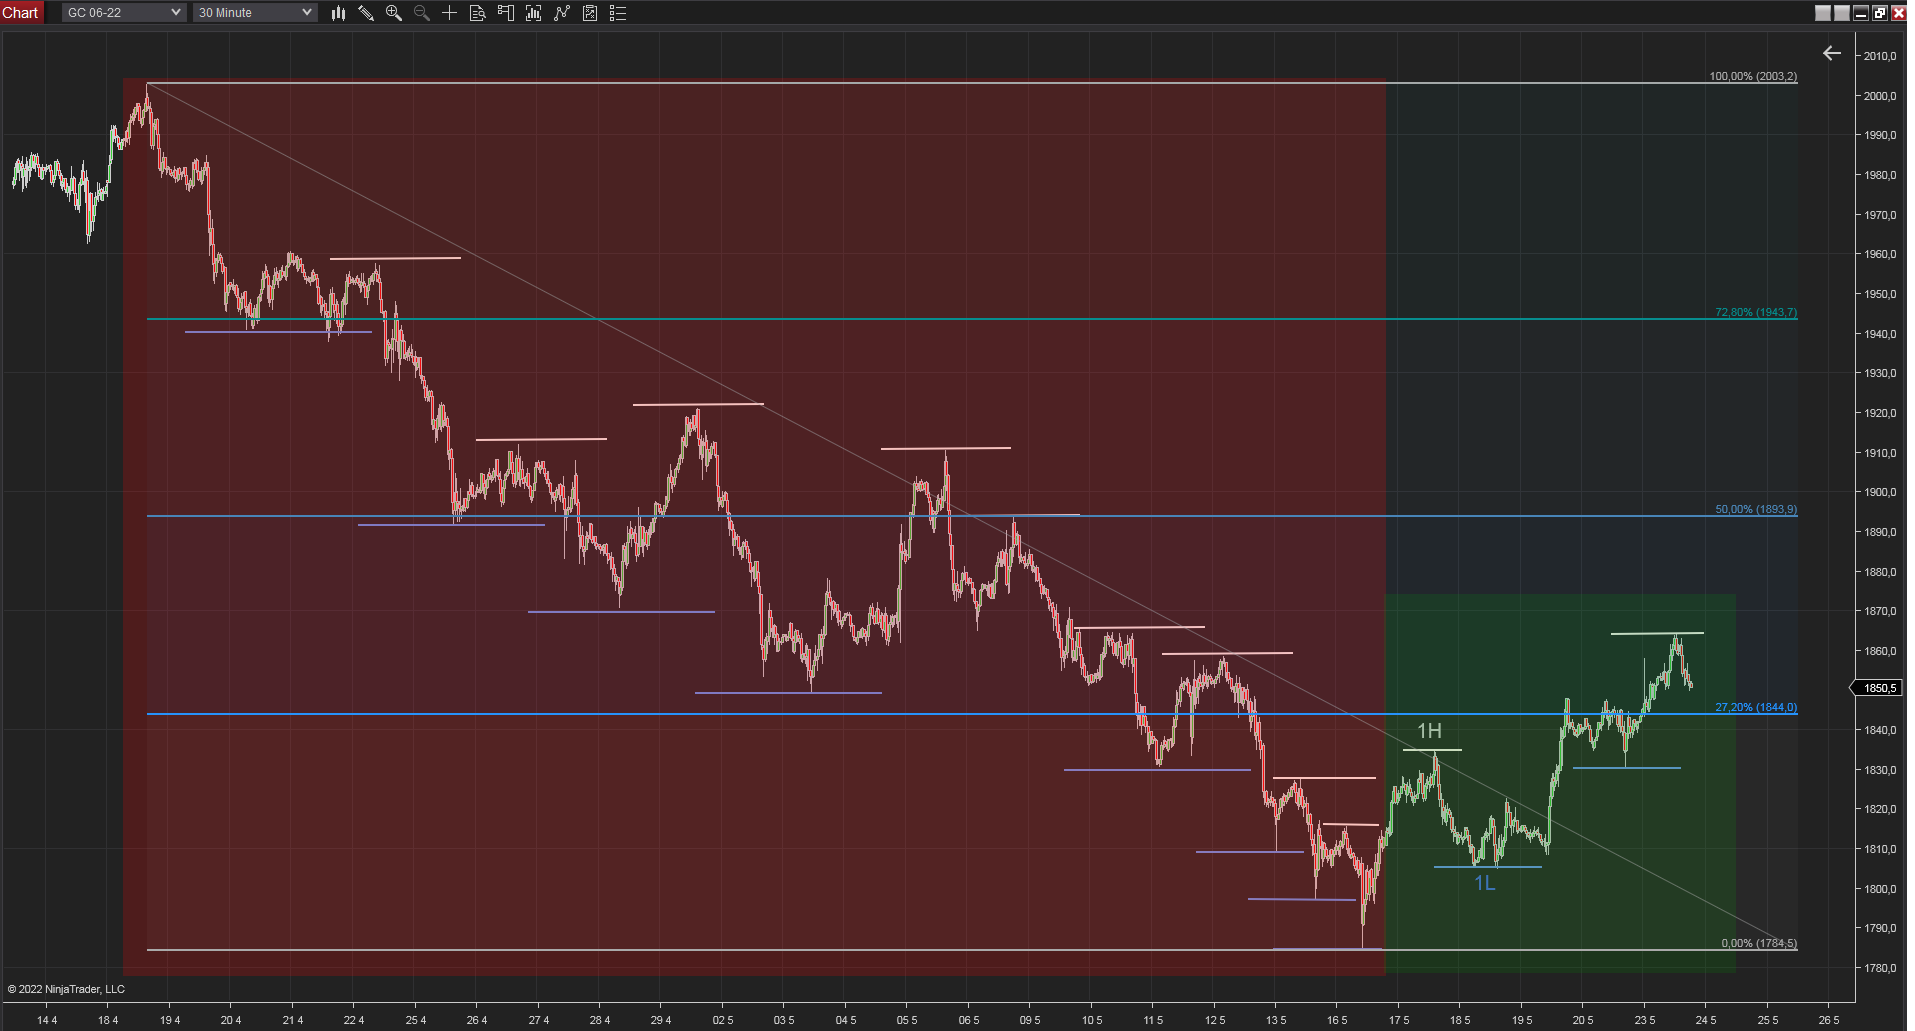
30 minutes chart of GC (Gold futures), Break of downtrend. Source: Author’s analysis
Technical analysis
If we look at the daily volume on gold futures (chart below), we can see concentrated volume from 19th and 20th of May (blue rectangle). This volume has pointed out POC line at 1841.2$. This level is supported by daily pivot point. In addition, the chart above highlights the level 27.2% of Fibonacci retracements of mentioned downtrade. And this level lays at 1844.0$.
Read more about: Indonesia resumes palm oil exports
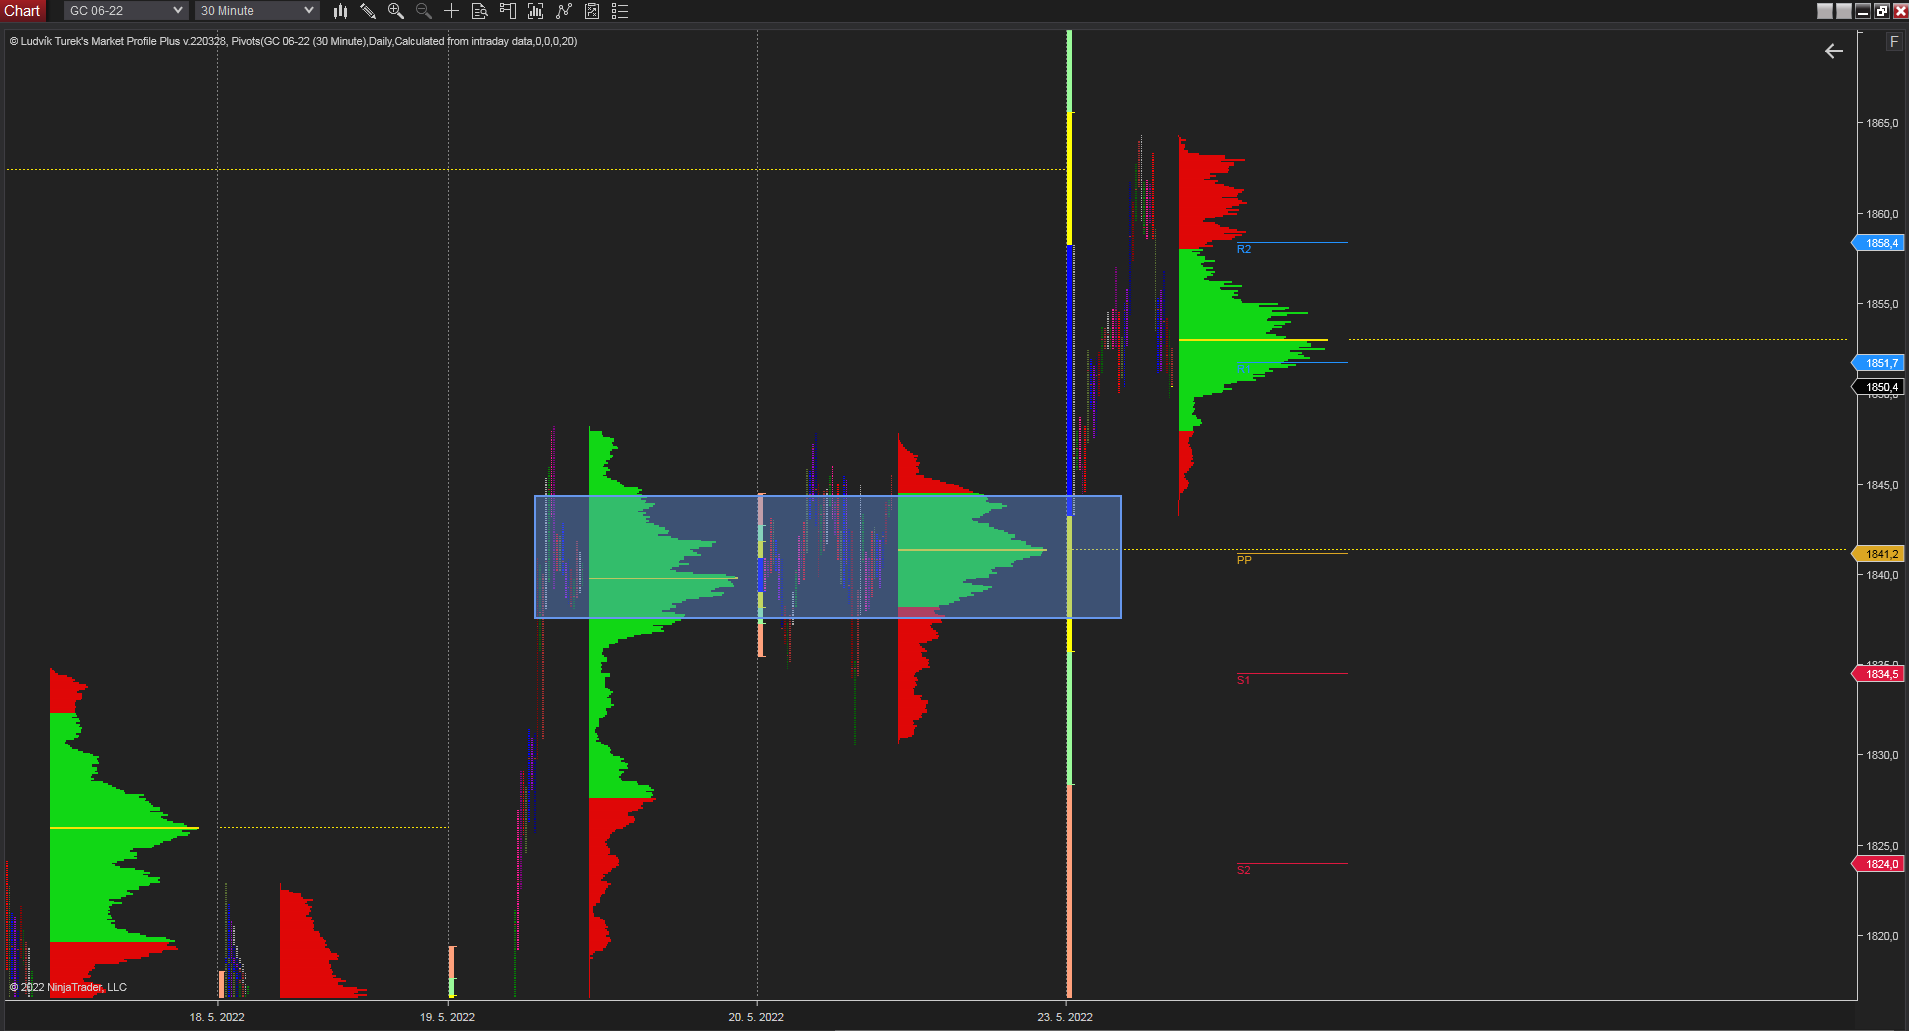
30 minutes chart of GC, Daily market profile. Source: Author’s analysis
Trend is your friend
Trend is your friend is a common rule in trading. It means, trade in the direction of the trend brings higher probability of profits. But what if this trend is broken? In this case there is another common rule of trading to follow which states that the traders should trade data not their feelings. Current break of downtrend could signal a potential side move or uptrend. Price goes up and volume shows the first support area at 1841.2$ -1844.0$.


Comments
Post has no comment yet.