Fibonacci retracement as a support
Last week gold futures successfully breached the resistance level at 1849.8$. The indications showed a possible end of a month long downtrend on gold. In our previous article we pointed out pattern for breaking a trend. Now, the price of futures is trading above 27.2% Fibo level. In addition, Fibonacci retracement levels appear from mentioned downtrend. The chart below shows, how many times the price has fought with this technical line in the last 8 trading days (test of the level is shown by white arrow).
Monthly volume accumulation
The importance of Fibo level is underlined by monthly volume accumulation. This volume is displayed at the right side of the chart. As you can see, the biggest volume (green colour of the profile) is on 1858.8$ price tag. The green area range is 1831.5 – 1884.7 and the 27.2% Fibo level is at level 1849.8$.
Read also: Africa as a new source of the world’s metal
That means the support level is in the volume area, moreover, close to the POC of the month. This gives a lot of importance to the technical Fibo line. Next supports lay at 1828.1 and 1818.3. On the other hand, higher resistance could be at 1882$, right under magical 1900$ per ounce. Whole numbers are considered a magnet, meaning those numbers have impact on retail’s trading. In other words, a significant number of orders are cumulated around whole numbers.
We analyzed also: G-7 take steps towards cleaner energy
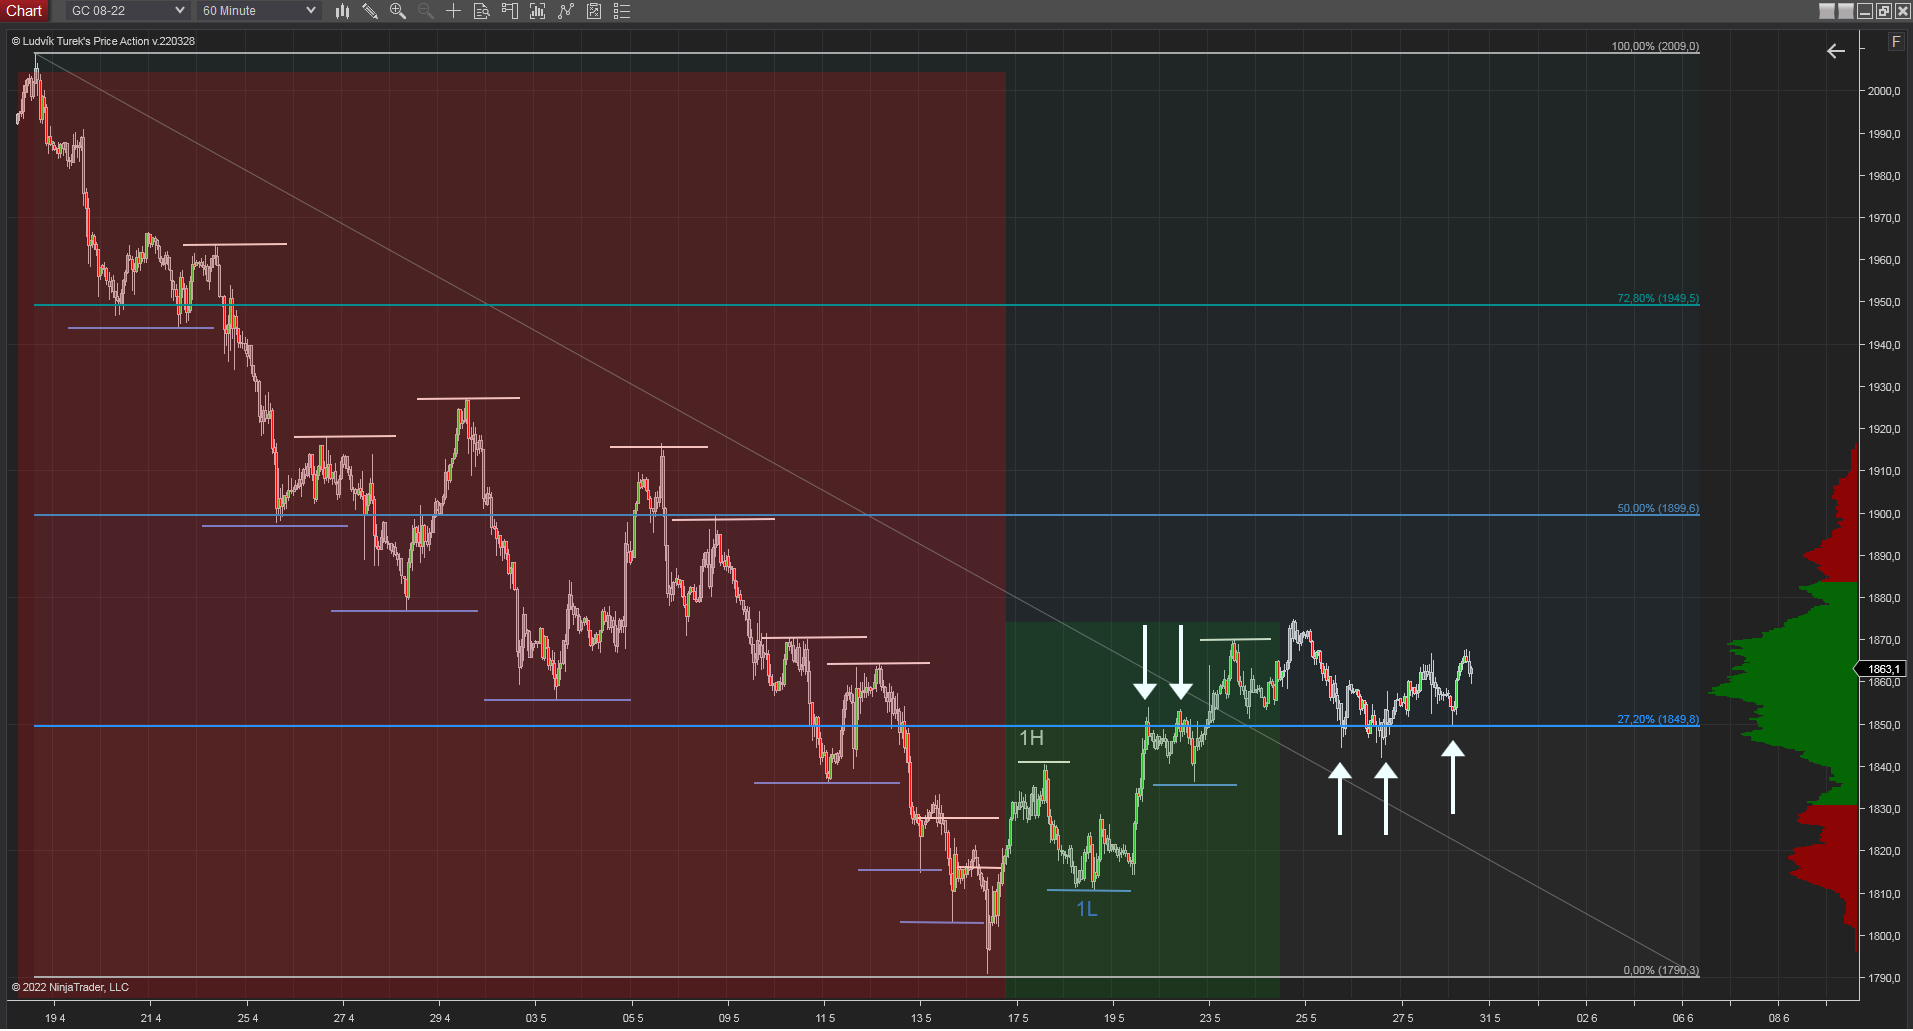
30 minutes chart of GC (Gold futures), Fibonacci level 27.2% and Monthly volume area. Source: Author’s analysis
Yellow metal’s monthly performance
Gold’s performance in comparison to the rest of the market is not very shining. Month to date performance shows red territory and a loss of -2.54%. One of the biggest gainers are commodities affected by Russia-Ukraine war such as Natural Gas with +21.59% and Crude oil Brent with +11.95%. Performance of the yellow metal shows that despite the war in the eastern Europe, this safe haven has not been triggered this month. Gold has the biggest negative correlation with US bond yields. All these moves are about inflation data and Fed’s monetary policy. The possibility of higher inflation and higher interest rates brings gold to lower levels.
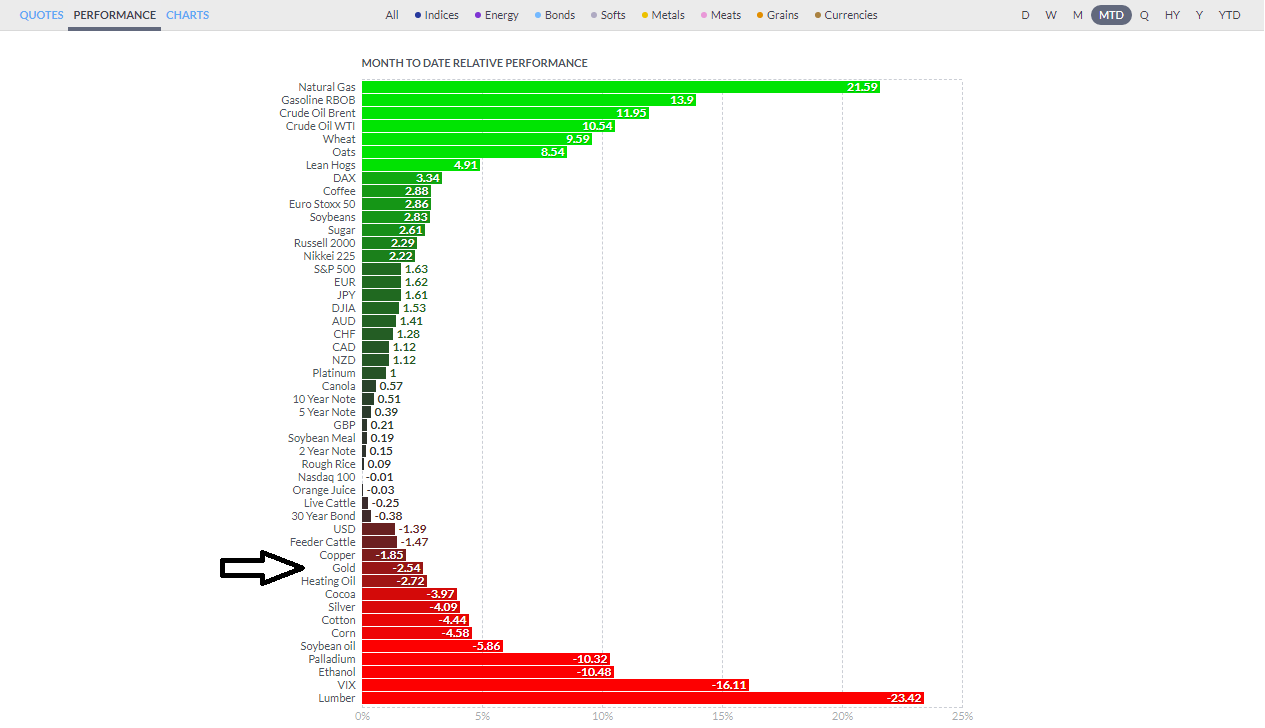
Month to date relative performance. Source: finviz.com


Comments
Post has no comment yet.