Commodities fall continues
The economic slowdown continues and causes significant turbulence in the markets. Monetary policies worldwide switch to rising interest rates, which reflects in the price of assets. Some projections for the following Fed meeting count with the 100bps hike on interest rates. The first calculation was 50bps. After a few weeks the possibility of 75bps hike was announced. The inflation data from the US were released this week and the CPI numbers increased over 9% to 9.1%. This massive inflation data sparked speculations about 100bps rate hike. These rate hikes underline uncertainty in the economic condition. And uncertainty in the economy has negative pressure on the commodity sector.
Related: A distasteful month for commodities
Crude oil under 100$
Crude oil is hurt significantly. Price declined to 90$ price tag and erased -13.58% from the open to the week’s low at 90.56$. CL (crude oil futures) jumped back to 96$, but remained under the magical 100$ level. The sentiment seems to stay negative. There is no significant progress in the war conflict between Russia and Ukraine, economic progress in China is worse than expected and demand for oil consumption falls. To add, the dislocation between the physical price and financial price of crude oil remains wide.
We have informed about this topic: Why is the price of Crude oil so volatile?
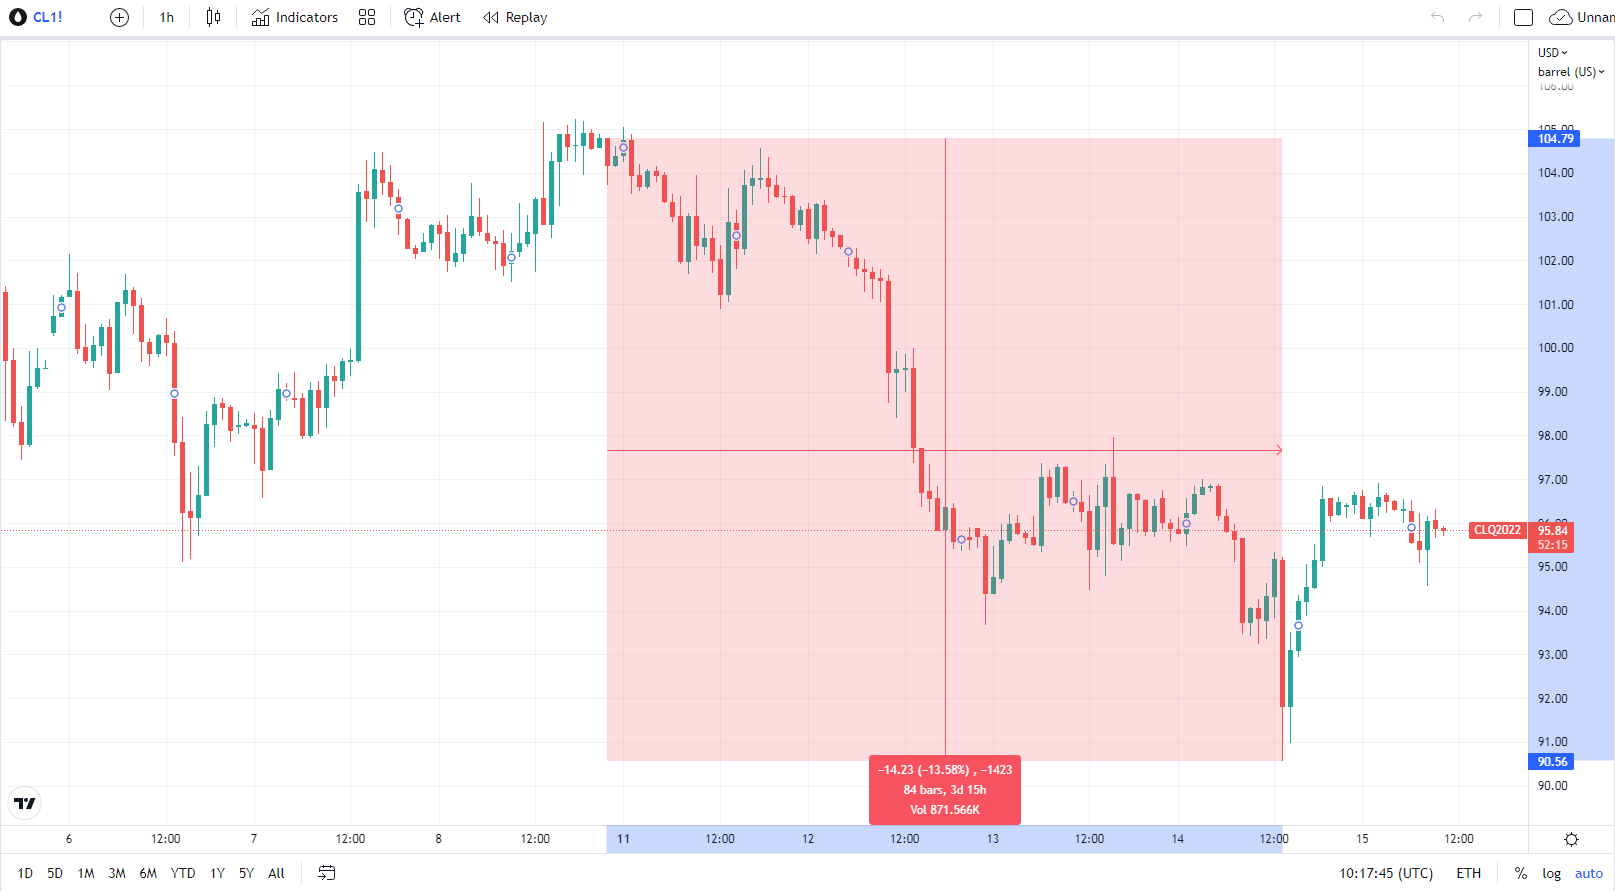
30 minutes chart of CL (Crude Oil Futures), Weekly development. Source: tradingview.com
The divergence between price and trading volume
Every coin has two sides. It would be a misinterpretation to think that oil “will” go down. That is simply not true. In the case of trading or investing, there has to be a ‘sober’ calculation with at least two possible scenarios. The sentiment stays negative. On the other hand, the latest fall in prices of crude oil shows the divergence between the price and trading volume. To be more specific, the price creates lower lows, but the volume delta shows a weaker bid side. In the chart below the divergence between the price of CL and its delta volume and cumulative delta is shown. Price has been declining until yesterday, but the deltas show the opposite move, which signals a possible pause in the fall of black gold prices.
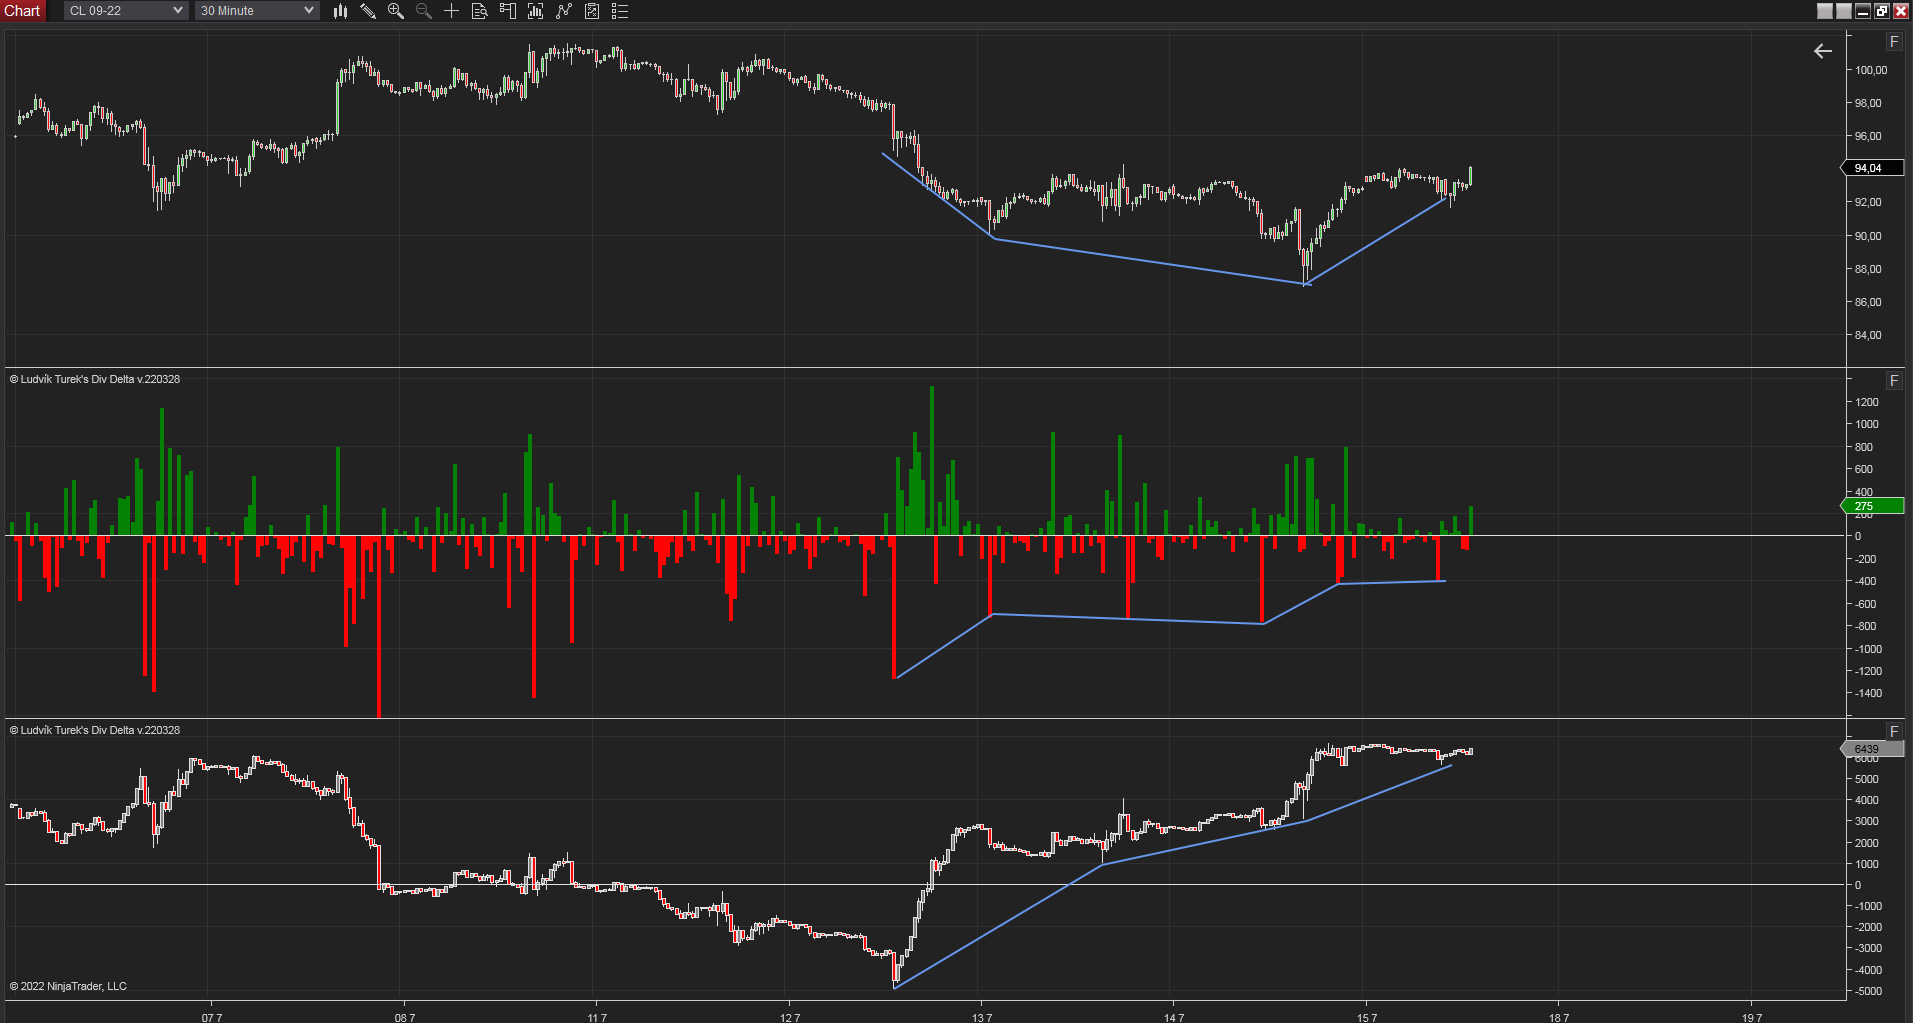
30 minutes chart of CL, Divergence delta in Crude Oil. Source: Author’s analysis
Psychological level as a resistance
The closest and strongest resistance level remains 100$ level. Greater volume has been traded around this level. And higher volume could work as a ‘magnet’ to fulfil orders. Therefore, if there is a pause in the decline and a bit of a retracement, mentioned resistance could be the level of interest.


Comments
Post has no comment yet.