October = Uptober?
It seems that October brings appreciation not only to Bitcoin but also to the commodities markets. Especially crude oil, since the black gold appreciated by 15.58% in the first 10 days of the month. Moreover, it erased all the losses from September and went back to the $90 territory. The chart below shows a ‘book example’ of a rising channel, a basic technical analysis charting technique. But what is more important are the actions that led to this situation.
You may be also interested in: Is Uptober coming? Bitcoin’s favourite month is here!
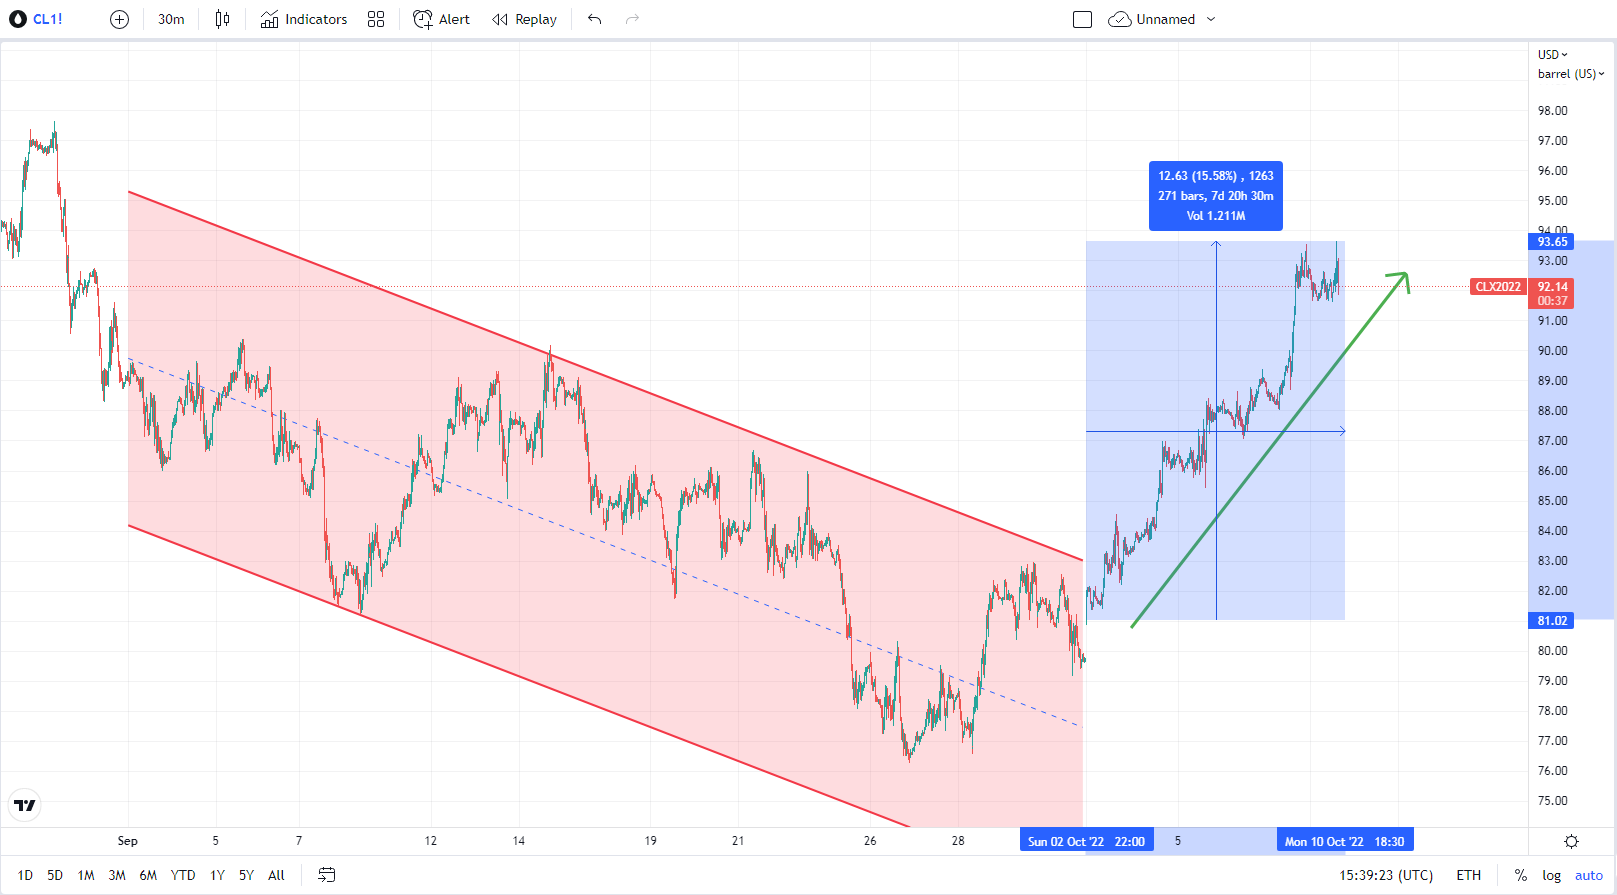
30 minutes chart of CL (Crude oil futures), Crude’s appreciation in October. Source: tradingview.com
Levels of interest
Volume data predominantly support current up-move of the commodity. The daily volume profile shows a clear continuous trend and rising volume on higher price levels, which supports the trend. It is important to mention that activity from the last 10 days left several levels of interest. The first level is $86.40 and the second is $88. Very important is the activity above the level of $90, where volume is significantly rising. This could be a sign of the rising appetite of investors and their willingness to go even further.
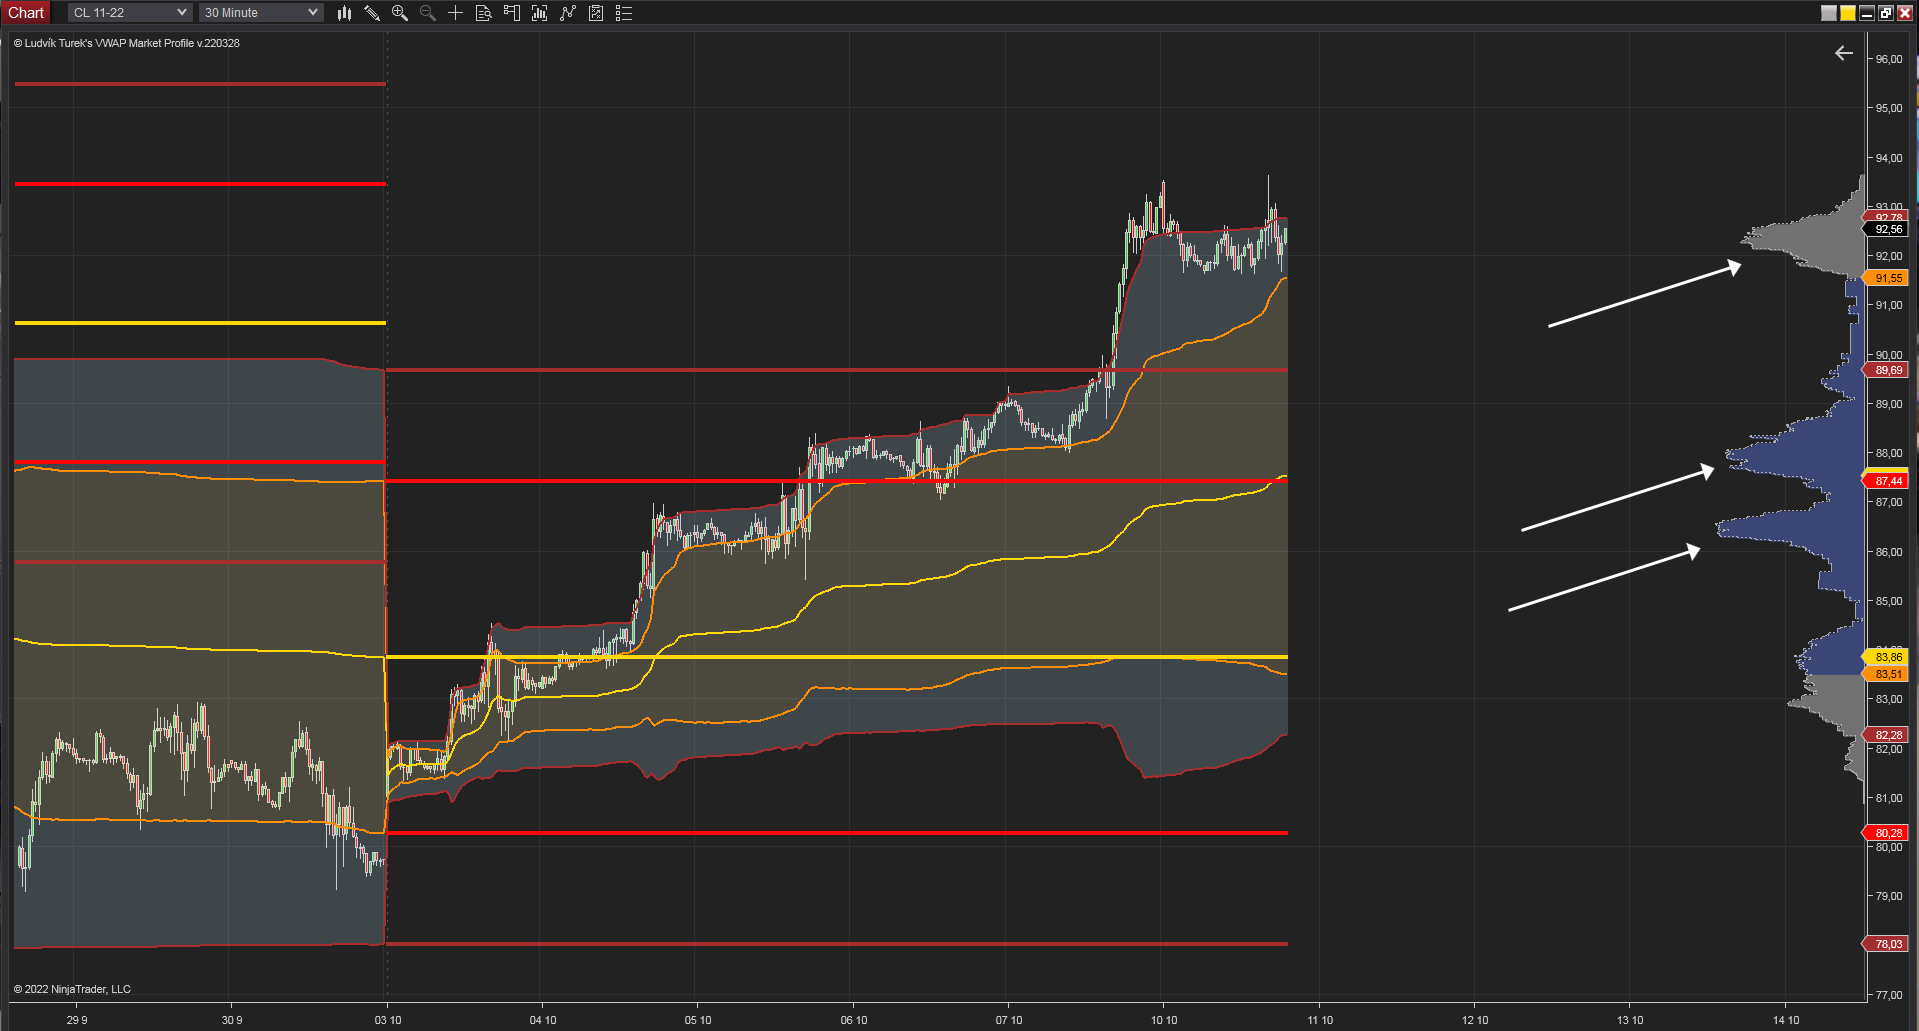
30 minutes chart of CL, Monthly VWAP, and levels of interest. Source: Author’s analysis
No signs of divergence…yet
In a situation like this, when the price move shows a trend, it is appropriate to check the bid/ask ratio. Specifically, bid/ask delta and cumulative bid/ask delta. The divergence delta is when the price makes higher highs, but the bid/ask delta and cumulative delta make lower highs. This development shows a potential divergence between the price and volume and could signal possible end of the trend. On the other side, if the price makes higher highs and deltas make higher highs as well, it could be stated that volume supports the actual price move and shows no big disproportions.
Today is the first day in the month when crude oil has not traded in significant green numbers. But the daily delta shows lower activity on the side of ask. This is no big deal until the price goes higher without the support of deltas.
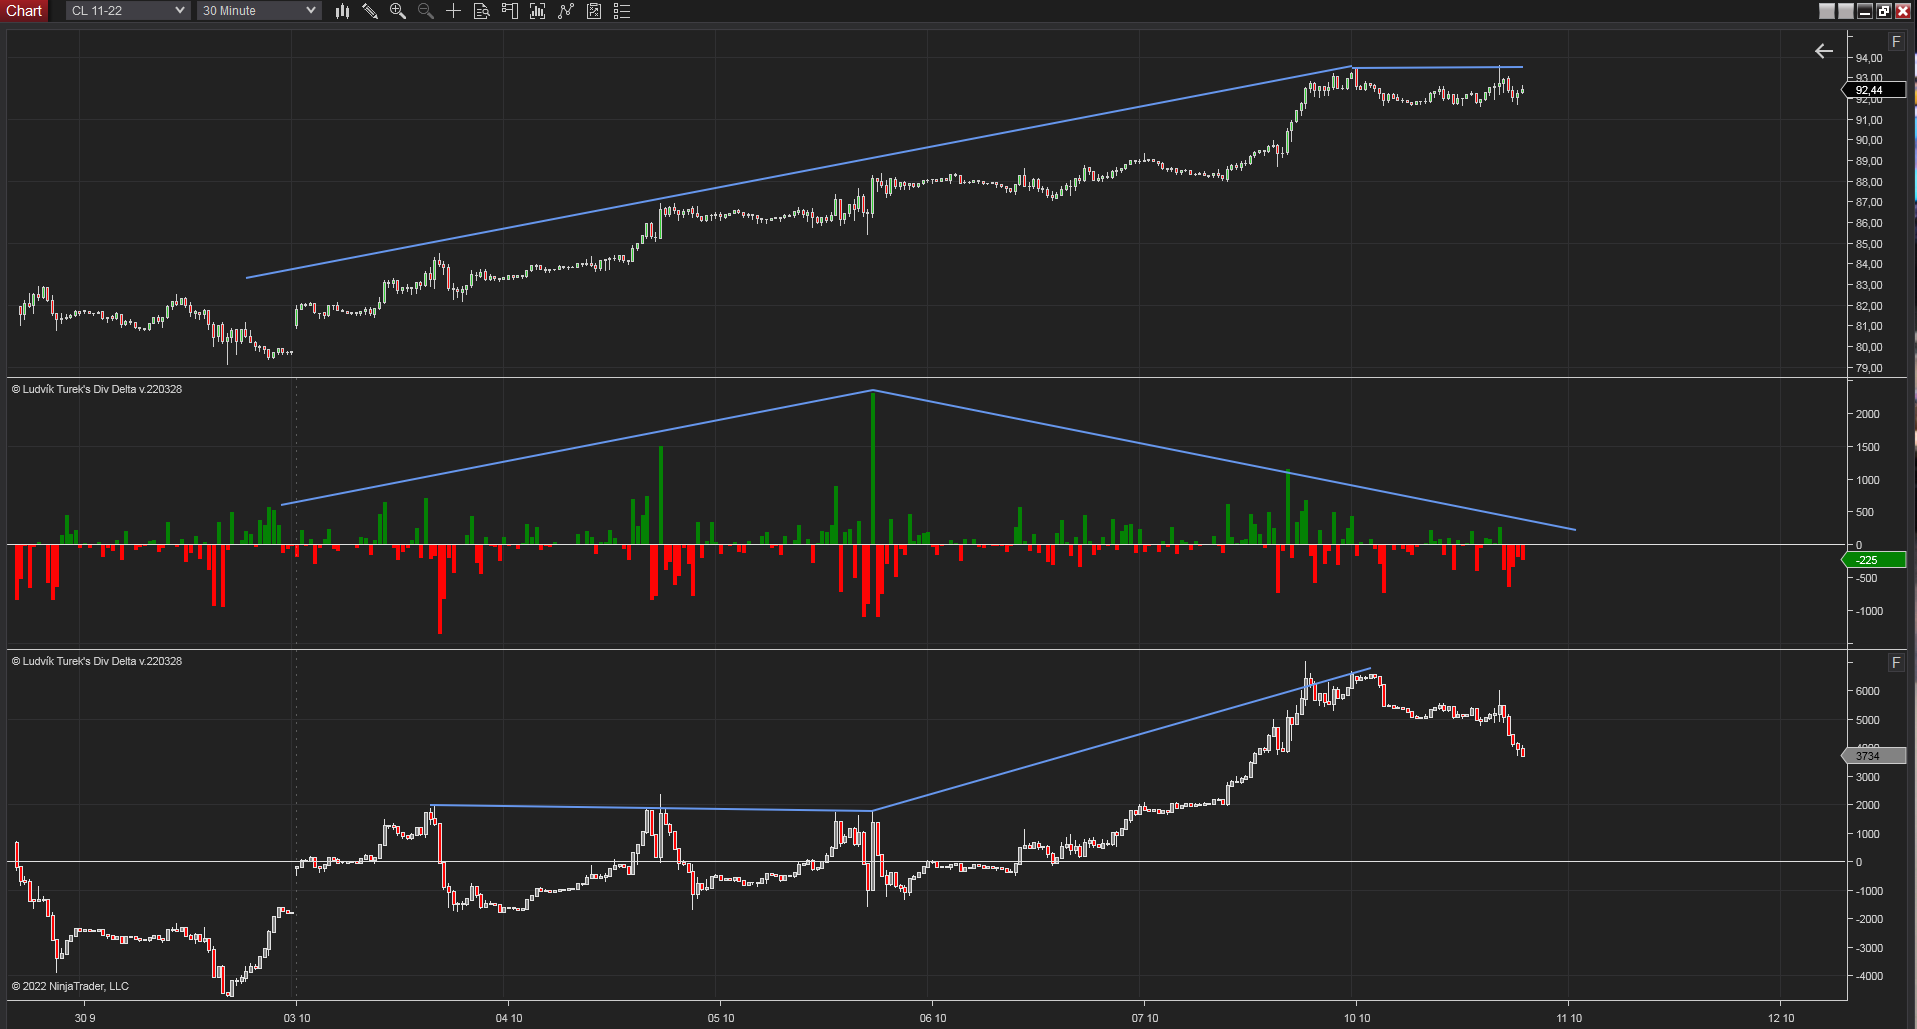
30 minutes chart of CL. Divergence delta indicator. Source: Author’s analysis
OPEC cut the oil supply
The above-mentioned price move is mostly the result of fundamental factors. At the beginning of this month, OPEC cut the oil supply when the Saudis threw away an agreement with Biden’s administration. The slash of 2 million barrels a day is the biggest production cut from 2020. Therefore the battle of energy-driven inflation continues. Rising volatility is expected, considering the cut is not the only price impact factor. The rising demand in China and the development of the war in Ukraine are just other factors from a long list.


Comments
Post has no comment yet.