Bitcoin fell by 5% along with other cryptocurrencies on Friday due to market uncertainty linked to a possible collapse of Silvergate. People fear again that Bitcoin is going to crash like it did several times throughout 2022, but isn’t the bear market over?
Bitcoin now vs Bitcoin in 2019
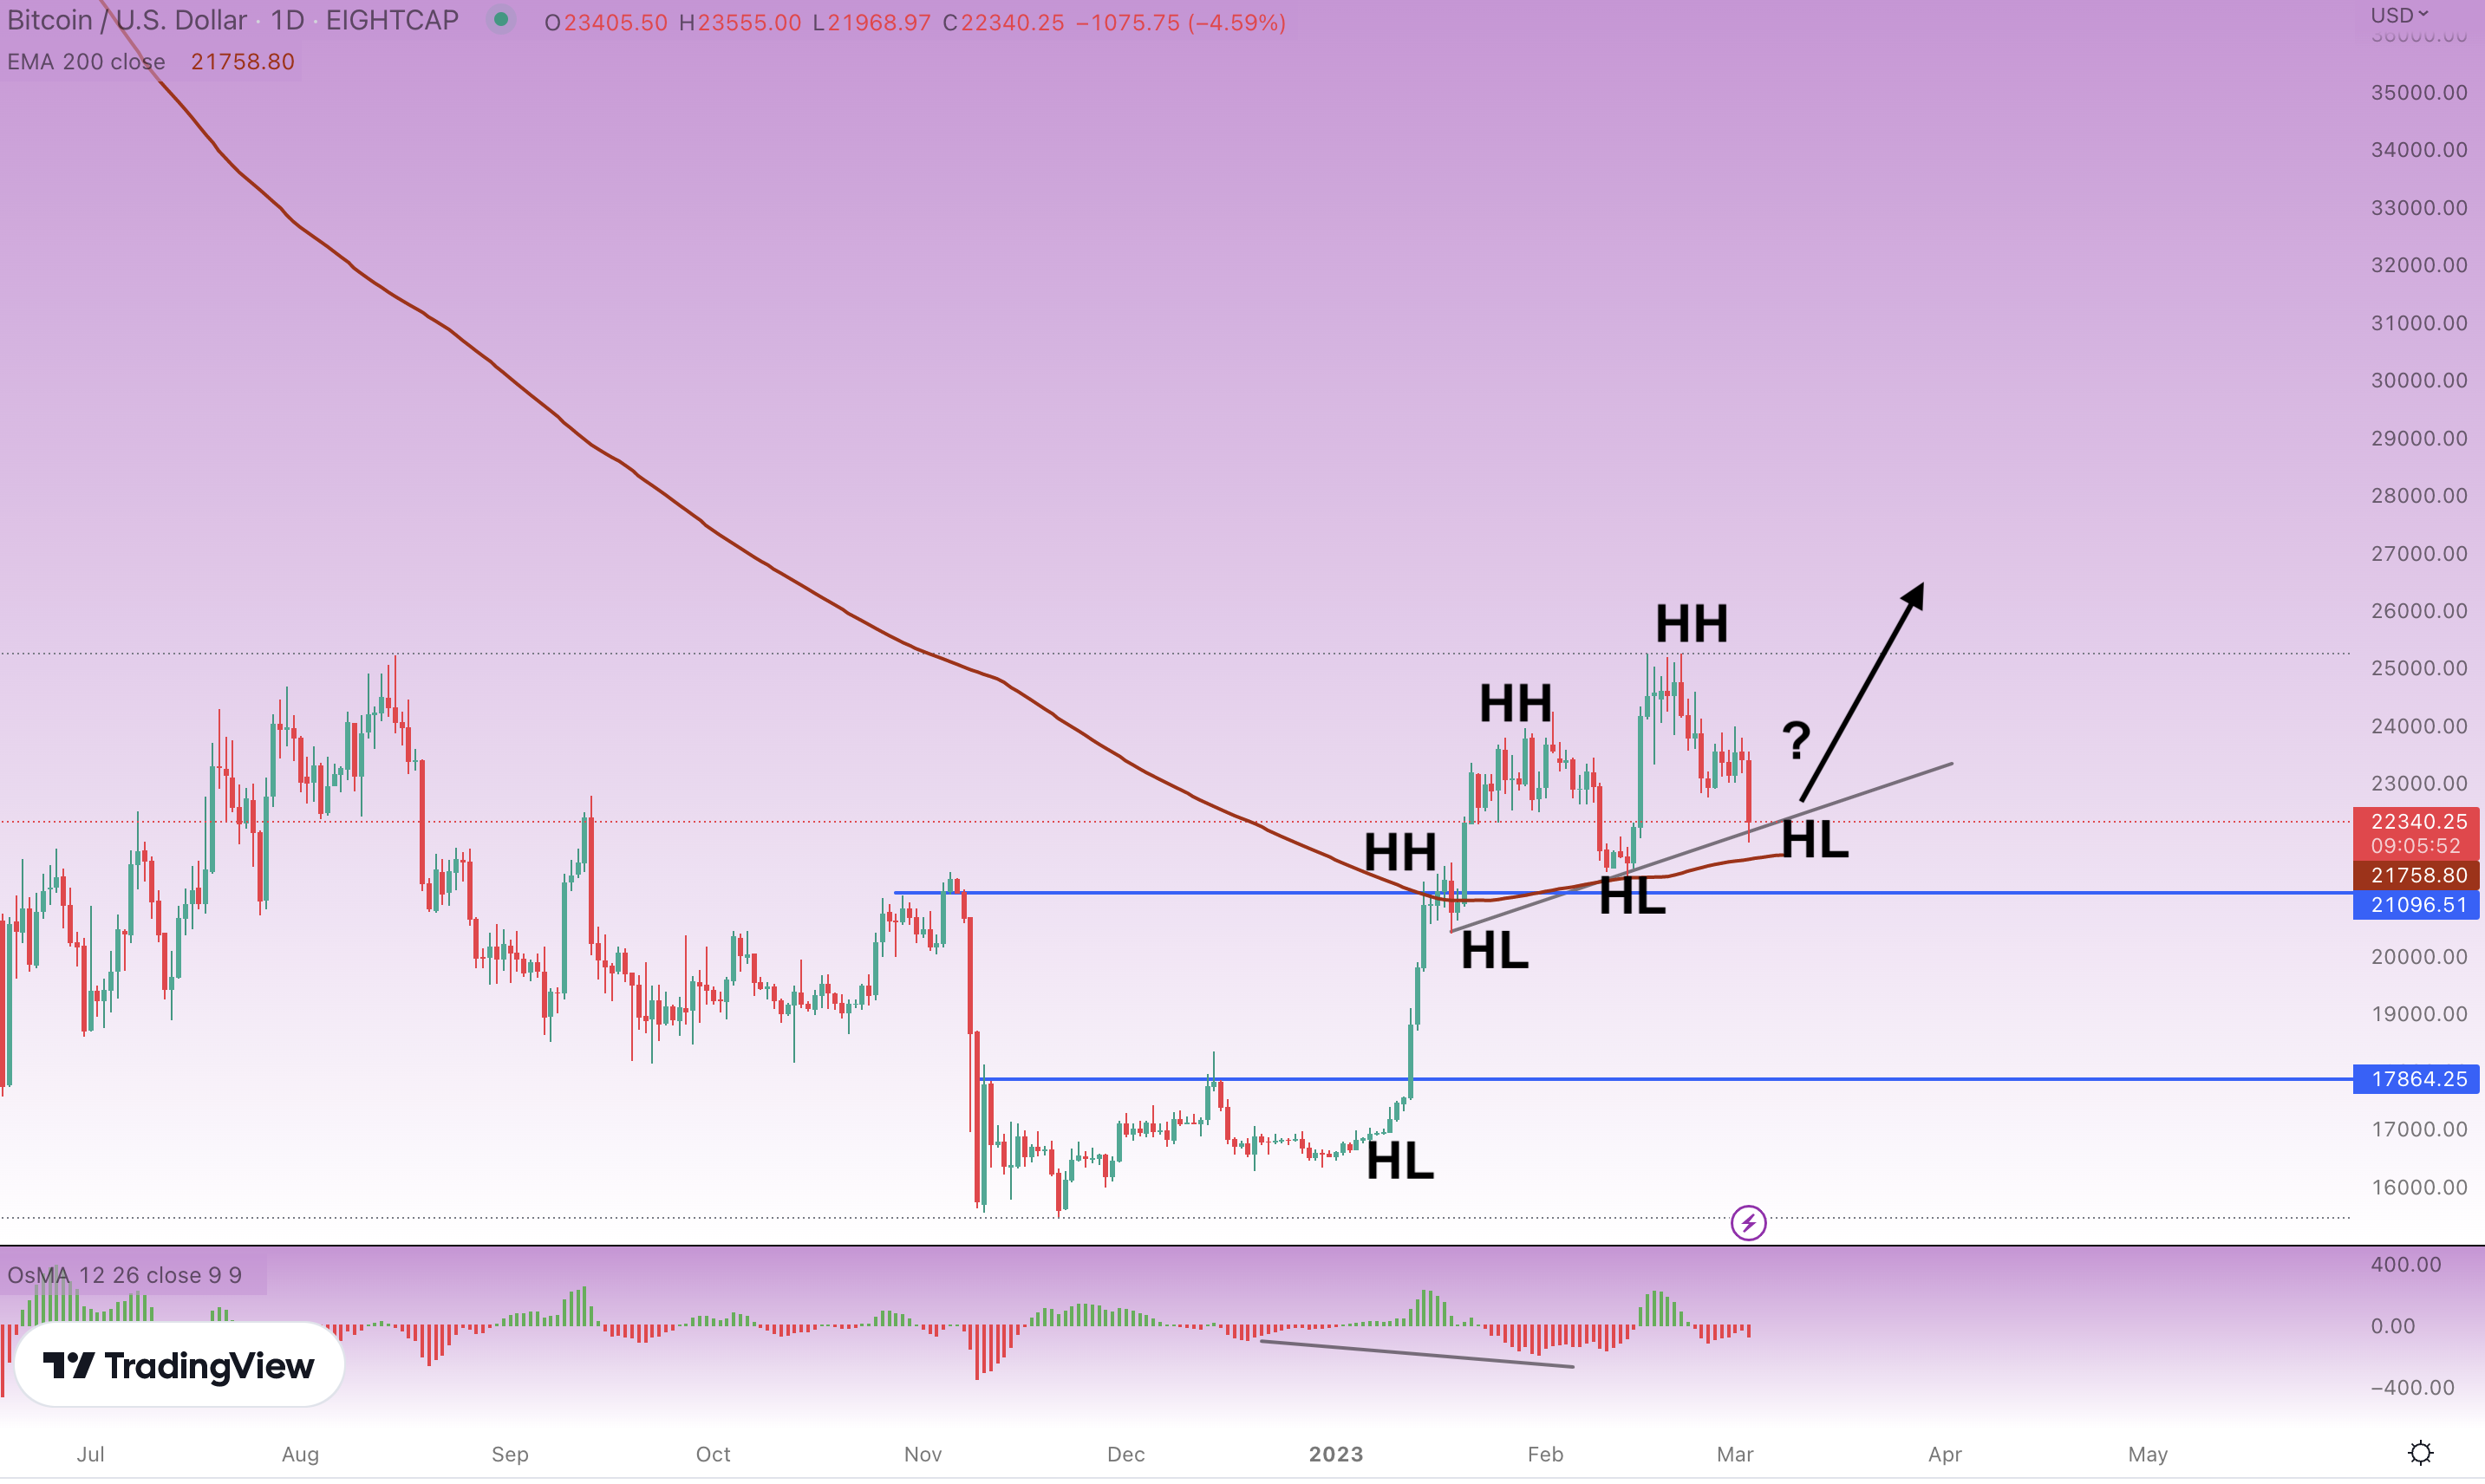
Bitcoin daily chart, source: tradingview.com, author’s analysis
Despite dropping by over 10% in two weeks, Bitcoin (BTC) is still up 43% from its bottom in November 2022. January’s kickstarting move upward has begun the rumors that the downtrend may be over, possibly sending Bitcoin back to its uptrend trajectory.
Also read: What should happen for Bitcoin to reach $10 million per coin?
The three strongest bear markets took approximately one year to finish, so why should this one be any exception? The situation is somewhat similar to the one in 2019. In both cases, the downtrend ended with the arrival of a new year (2023 this time) and the creation of higher lows (HL) along with higher highs (HH).
Bitcoin rose above the pre-FTX level, slowly continuing in its long-term upward move. It is above support, moving average (EMA 200), and bouncing back up from the trend line. There was also a divergence that sent Bitcoin back up from $21,000 to $25,000 in February. A similar thing happened in 2019.
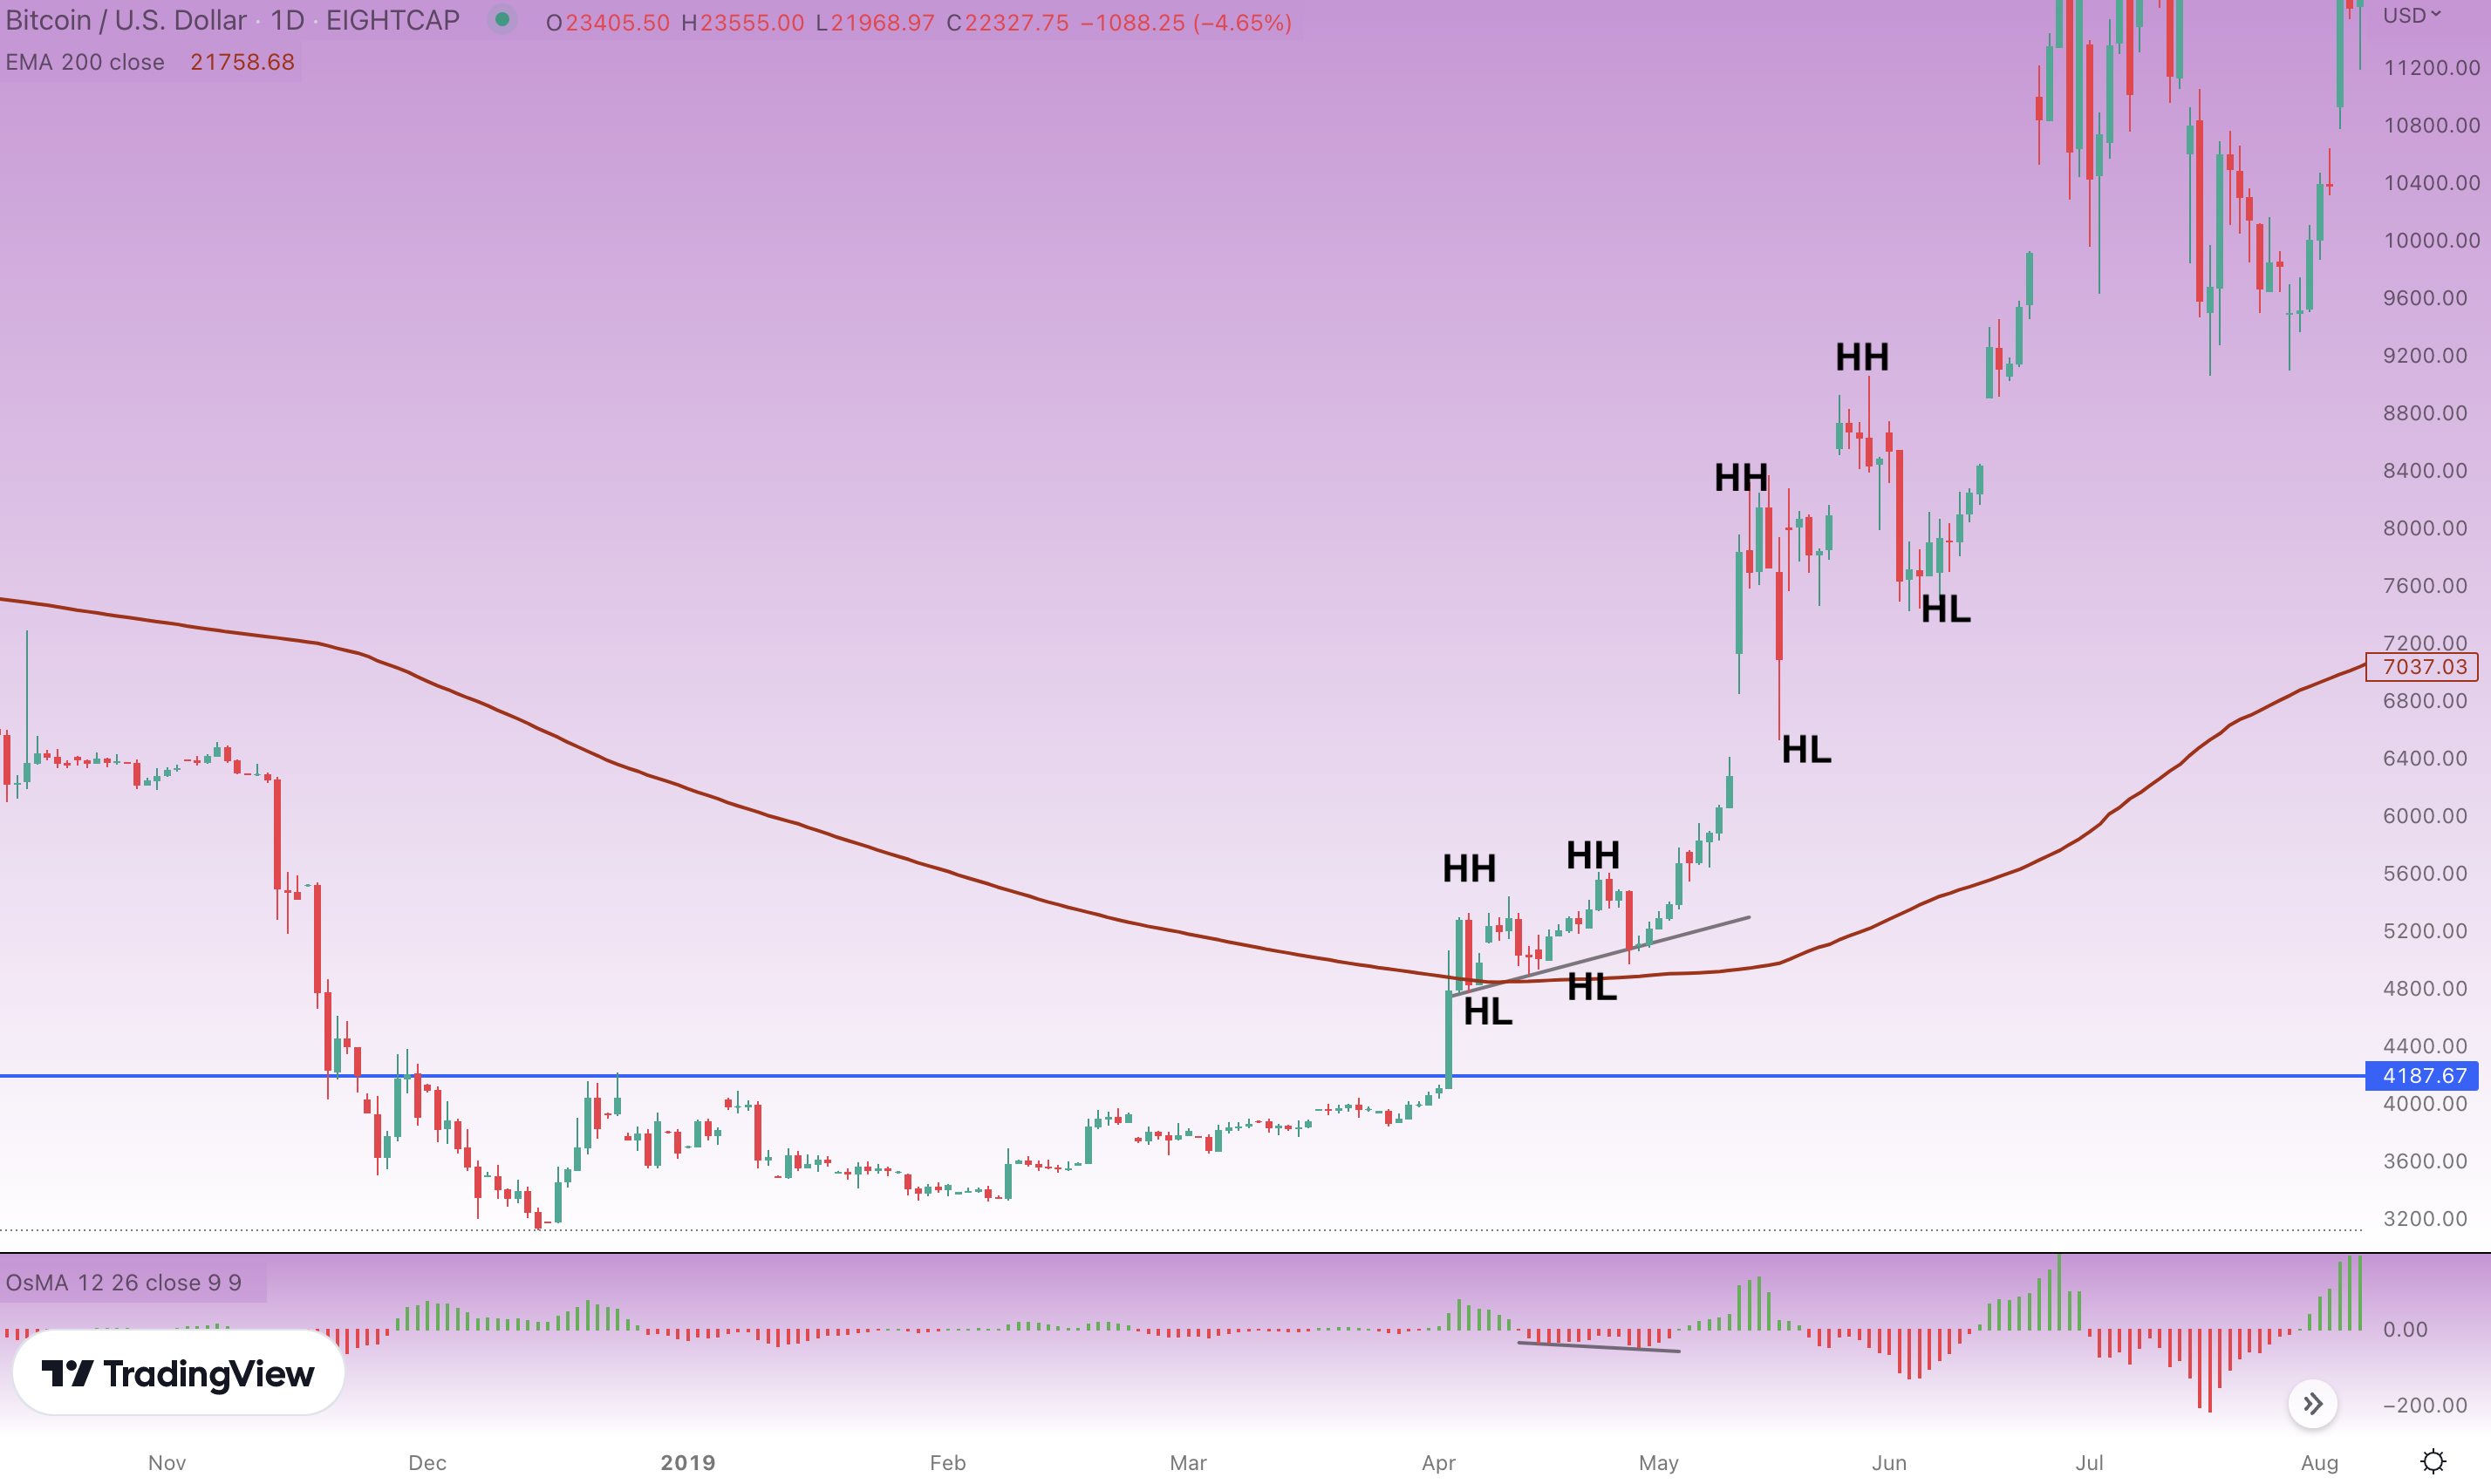
Bitcoin daily chart from 2019, source: tradingview.com, author’s analysis
Bitcoin started creating HL and HH, aggressively pushing higher after a prolonged bear market. There was a comparable price action as today, where BTC bounced from the trend line along with EMA200. Divergence, of course, helped take the digital gold higher as well.
However, it is important to remember the market cap of BTC is now much higher than it used to be, so Bitcoin may not jump by over 400% as it did in 2019. However, if it only manages to rise by 100% or 150%, Bitcoin could reach $31,000 to $38,500 in 2023.
Bitcoin vs interest rates
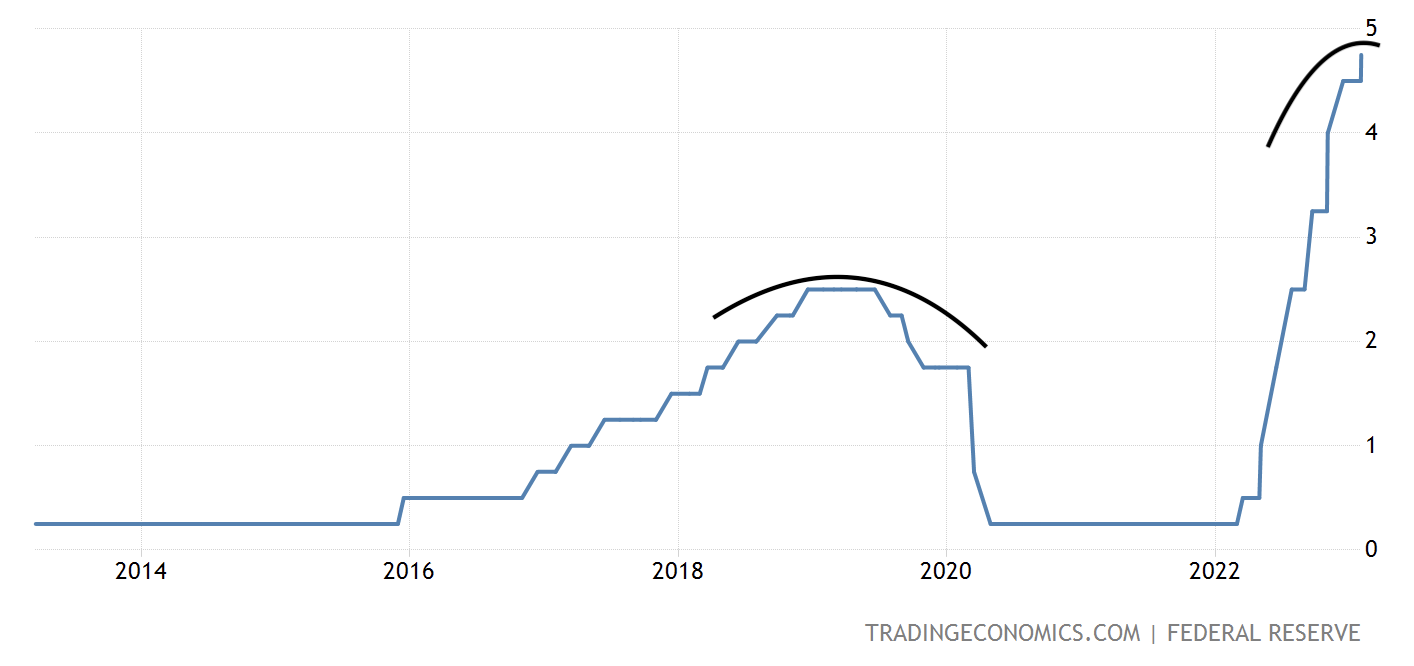
Fed’s interest rates chart, source: tradingeconomics.com
A lot of investors may not realize this, but Bitcoin’s bottom formed in 2019 around the time when Fed’s interest rates reached their peak. The following rate cuts only supported the ongoing uptrend. It might be difficult to speculate if interest rates have already topped, but the time should be near.
Read more: What is the difference between cryptocurrency mining and staking?
Considering the fact that Bitcoin found its bottom in November may suggest that the uptrend has already begun, with a peak in interest rates. Although Fed suggested another rate hike might be on the way, it shouldn’t be more than one or two.
Bottom line
It is likely that the uptrend will continue. That doesn’t mean investors should go all in or over-leverage their positions. In such uncertain times, dollar-cost averaging is still considered the safest strategy for investing in crypto.
But remember that if Fed increases interest a few more times, Bitcoin could still go below $20,000 in the short time period.


Comments
Post has no comment yet.