According to Charles Edwards, Capriole founder, Bitcoin is currently in a textbook perfect formation called “Bump & Run Reversal,” which may indicate the Bitcoin bottom.
Bitcoin bottom formation
His tweet points out a possible Bitcoin bottom formation which could lead to an explosive price move to at least $100,000 in the next year or two. In fact, Bitcoin is up $10,000 since it hit $15,500 in November.
Read more: What should happen for Bitcoin to reach $10 million per coin?
Bitcoin gained more than 66% in approximately four months, implying the bulls are back in the game. Despite settling below $24,500 (right after hitting $26,000) at the time of writing, analysts are already getting optimistic about longer periods following the brutal 2022 bear market.
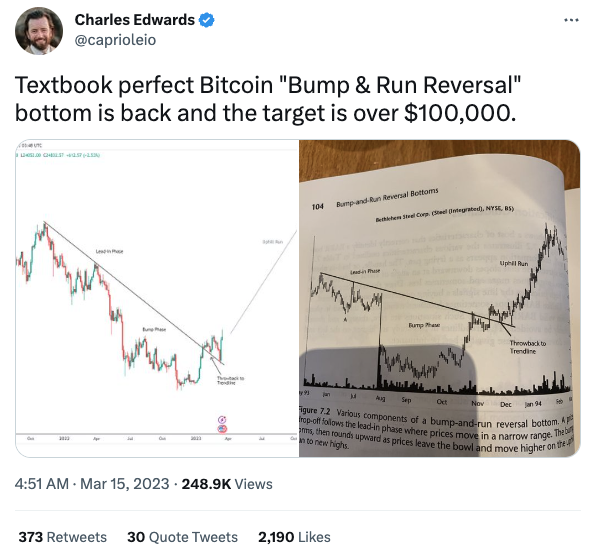
Charles Edward’s tweet on Bitcoin, source: twitter.com
A bullish reversal pattern, “the bump-and-run reversal bottom” usually develops after a sequence of falling peaks. The excessively negative sentiment along with gradual selling causes a precipitous drop in price.
Eventually, the downward trend is broken, and prices start moving upward again, like this time. But not so fast. While Bitcoin is aggressively trying to break the $25,000 level, it’s still not confirmed it can do it.
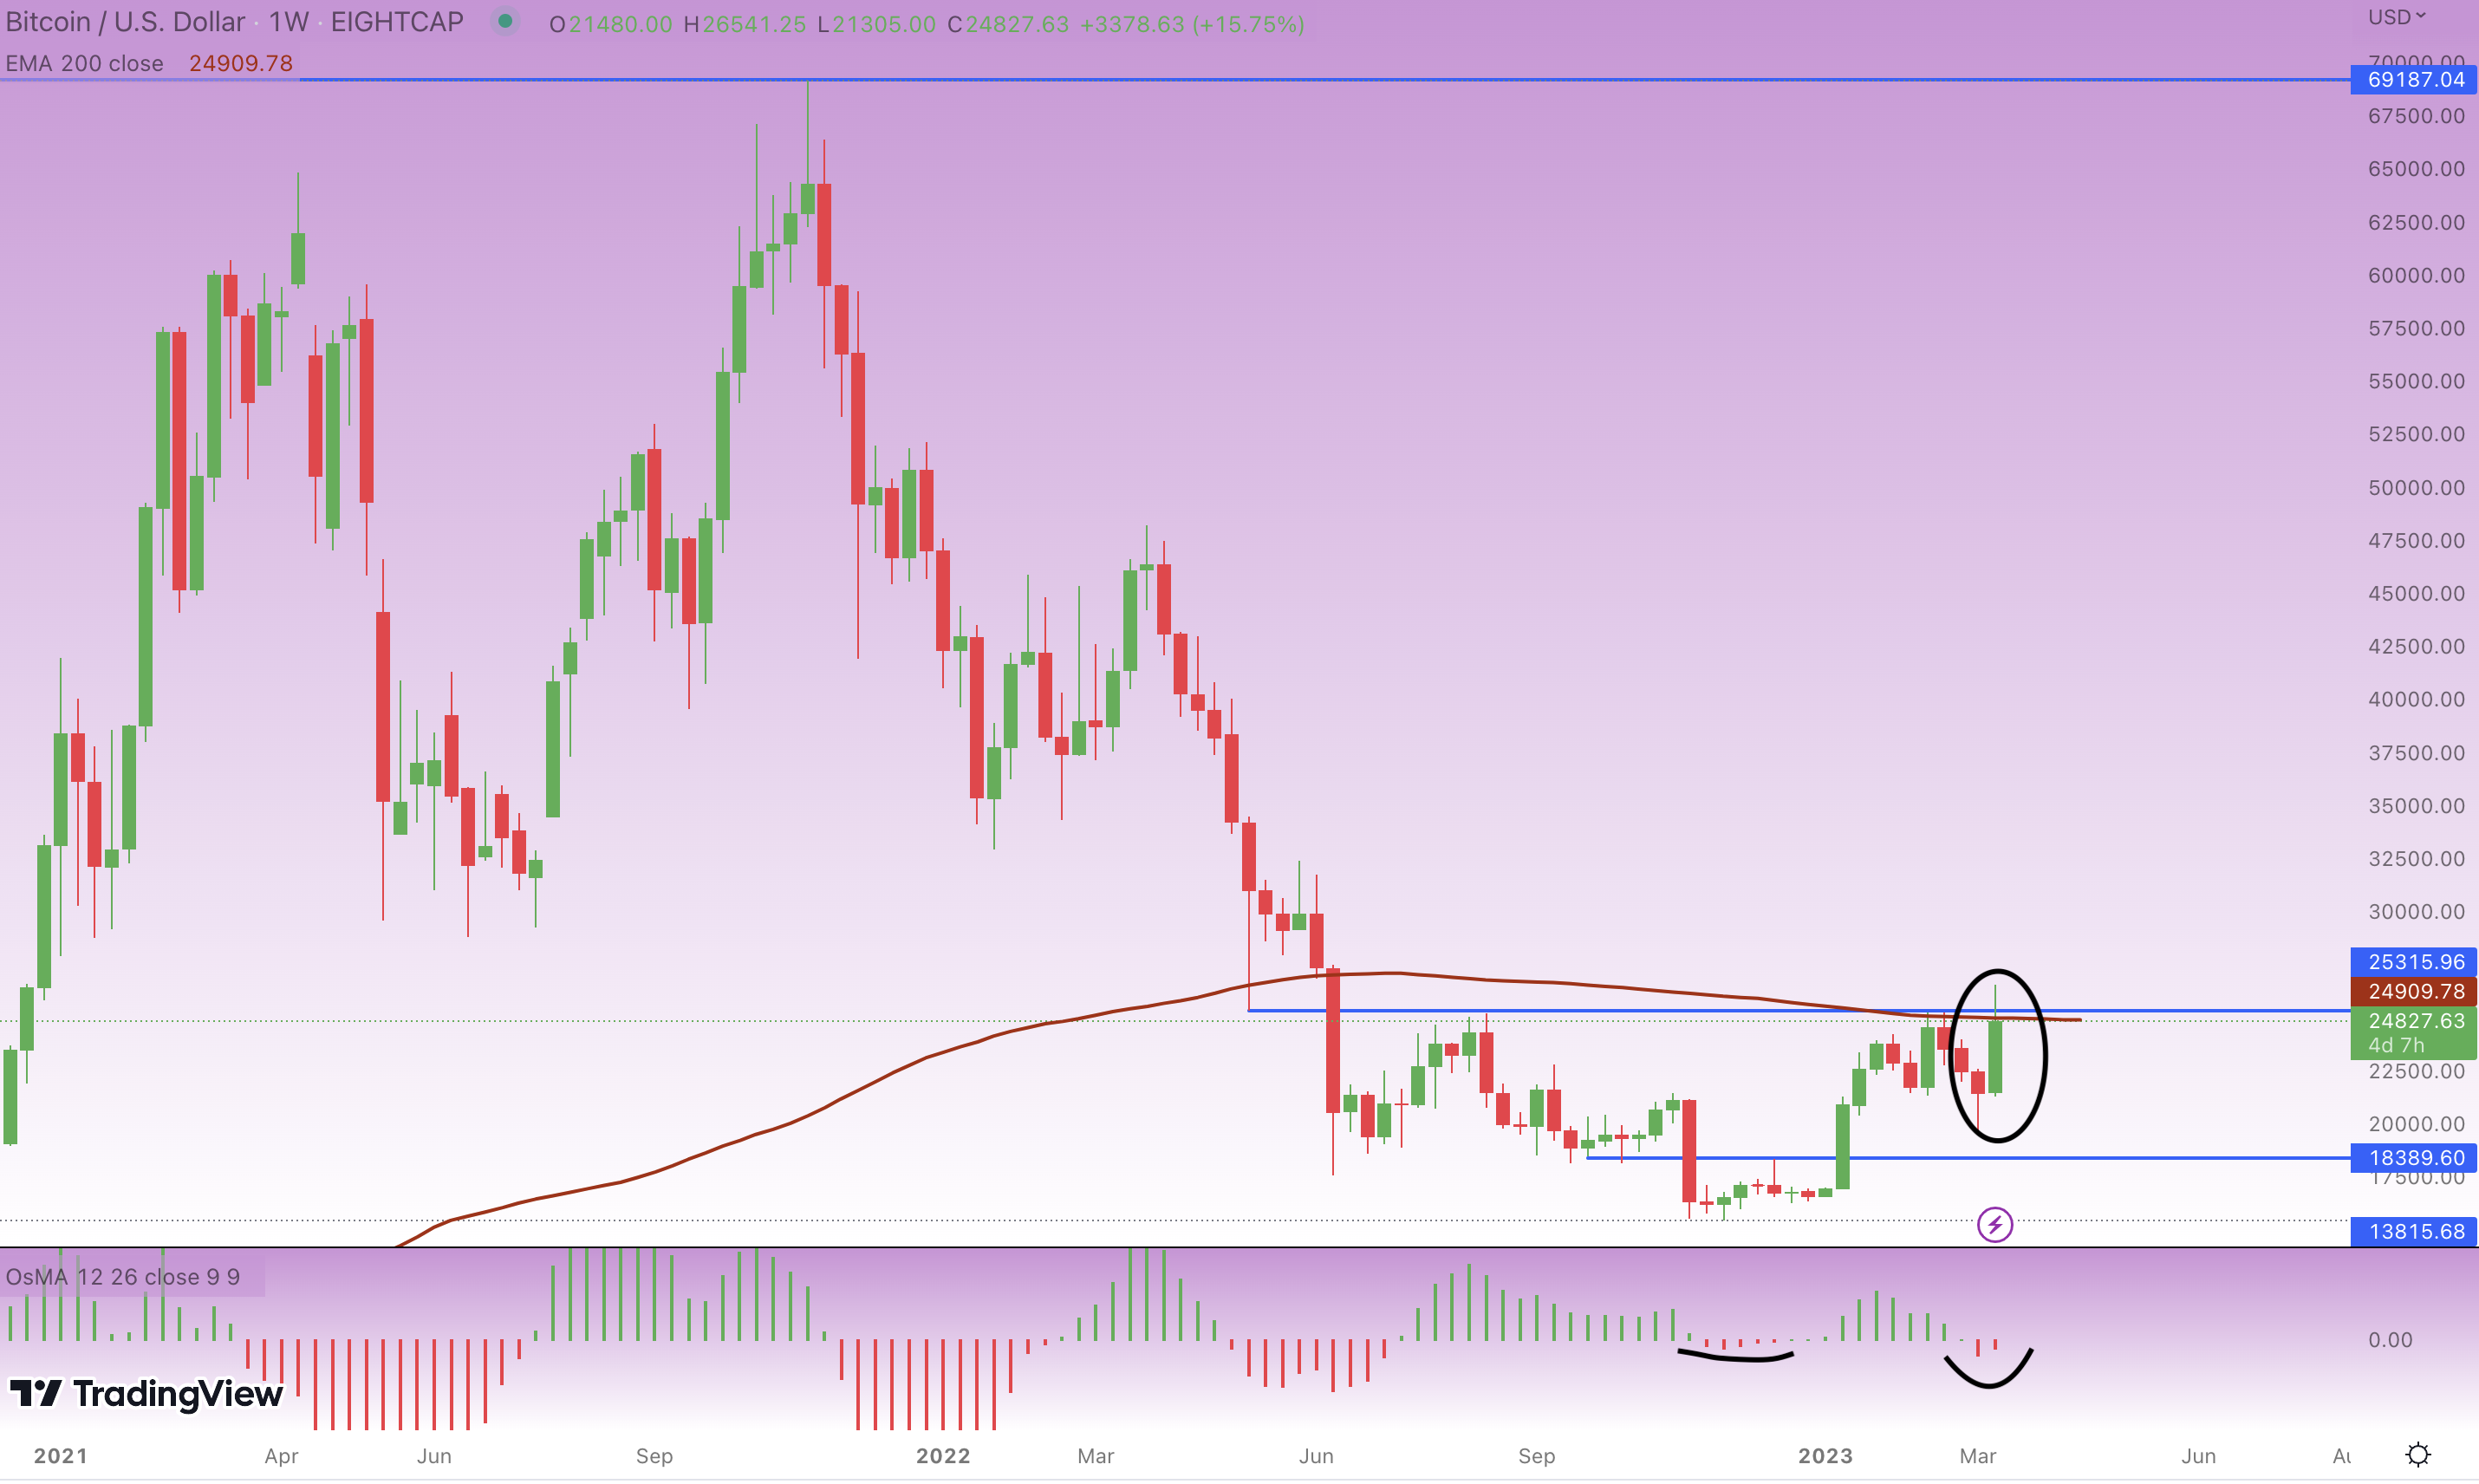
Bitcoin weekly chart, source: tradingview.com, author’s analysis
Breaking this resistance along with the moving average (EMA200) will be crucial to confirm the bull run is back. However, this huge bullish engulfing pattern suggests the price could be headed towards $30,000 at least.
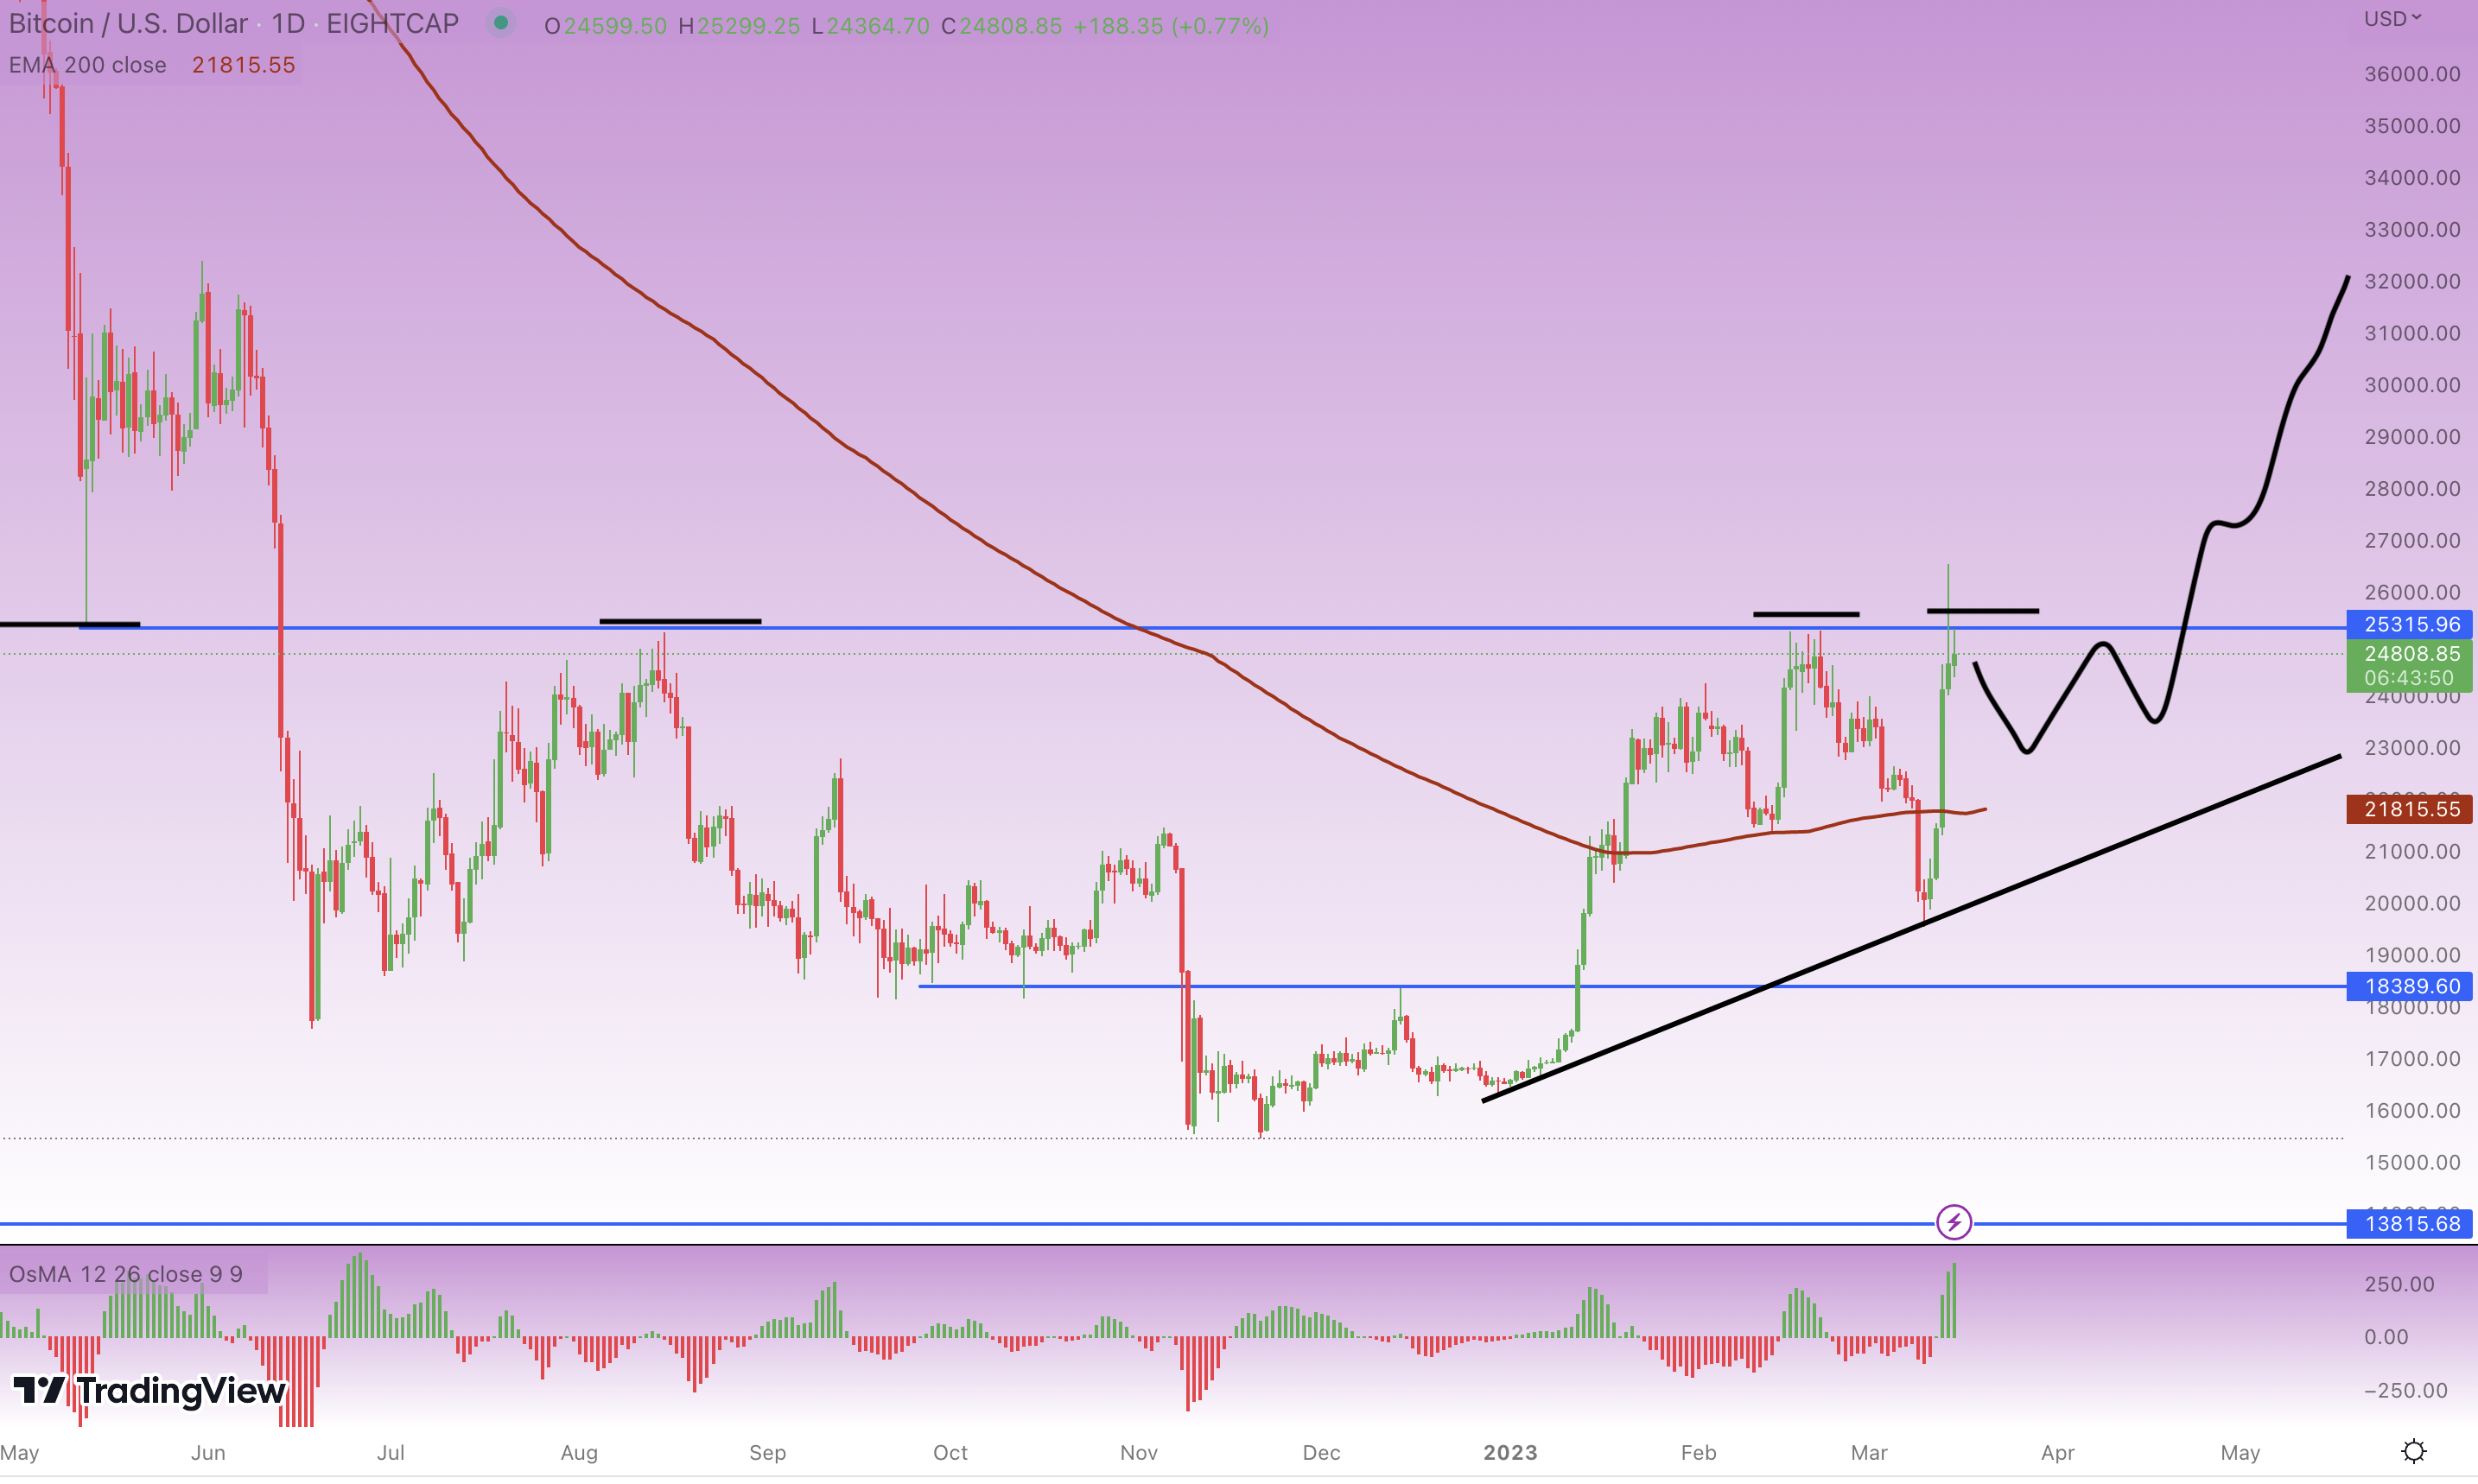
Bitcoin daily chart, source: tradingview.com, author’s analysis
The OsMA indicator still shows signs of an oversold market on the weekly timeframe, so it really looks bullish. Moreover, there is a recurring effort for higher lows and higher highs in the past couple of weeks, which created a triangle formation.
Final thoughts
Bitcoin could stay below the $25,000 resistance for a while, but it looks like it is poised to break this level and continue even higher. $30,000 could be easily reached until June as it is only a 20% move up from this price and Bitcoin is already up 66% from its bottom.
Also read: ChatGPT-4 is live – you will be amazed by what you can do with it
But don’t forget inflation and interest rates are still relatively high, which could cause Bitcoin to suffer more, especially if Fed decides to hike rates higher.


Comments
Post has no comment yet.