While the US dollar suffers losses, Bitcoin (BTC) hit $29,000 on Thursday, up from $15,500 in November 2022. Although Bitcoin seems to end the bear market from last year, the situation is getting heated all over again.
Bitcoin near $30,000 – what’s next?
On March 29th, Bitcoin hit $29,000, moving further with its bullish momentum. Bitcoin rose above a crucial resistance $25,315 and a 200-day moving average (EMA200) amid the banking crisis.
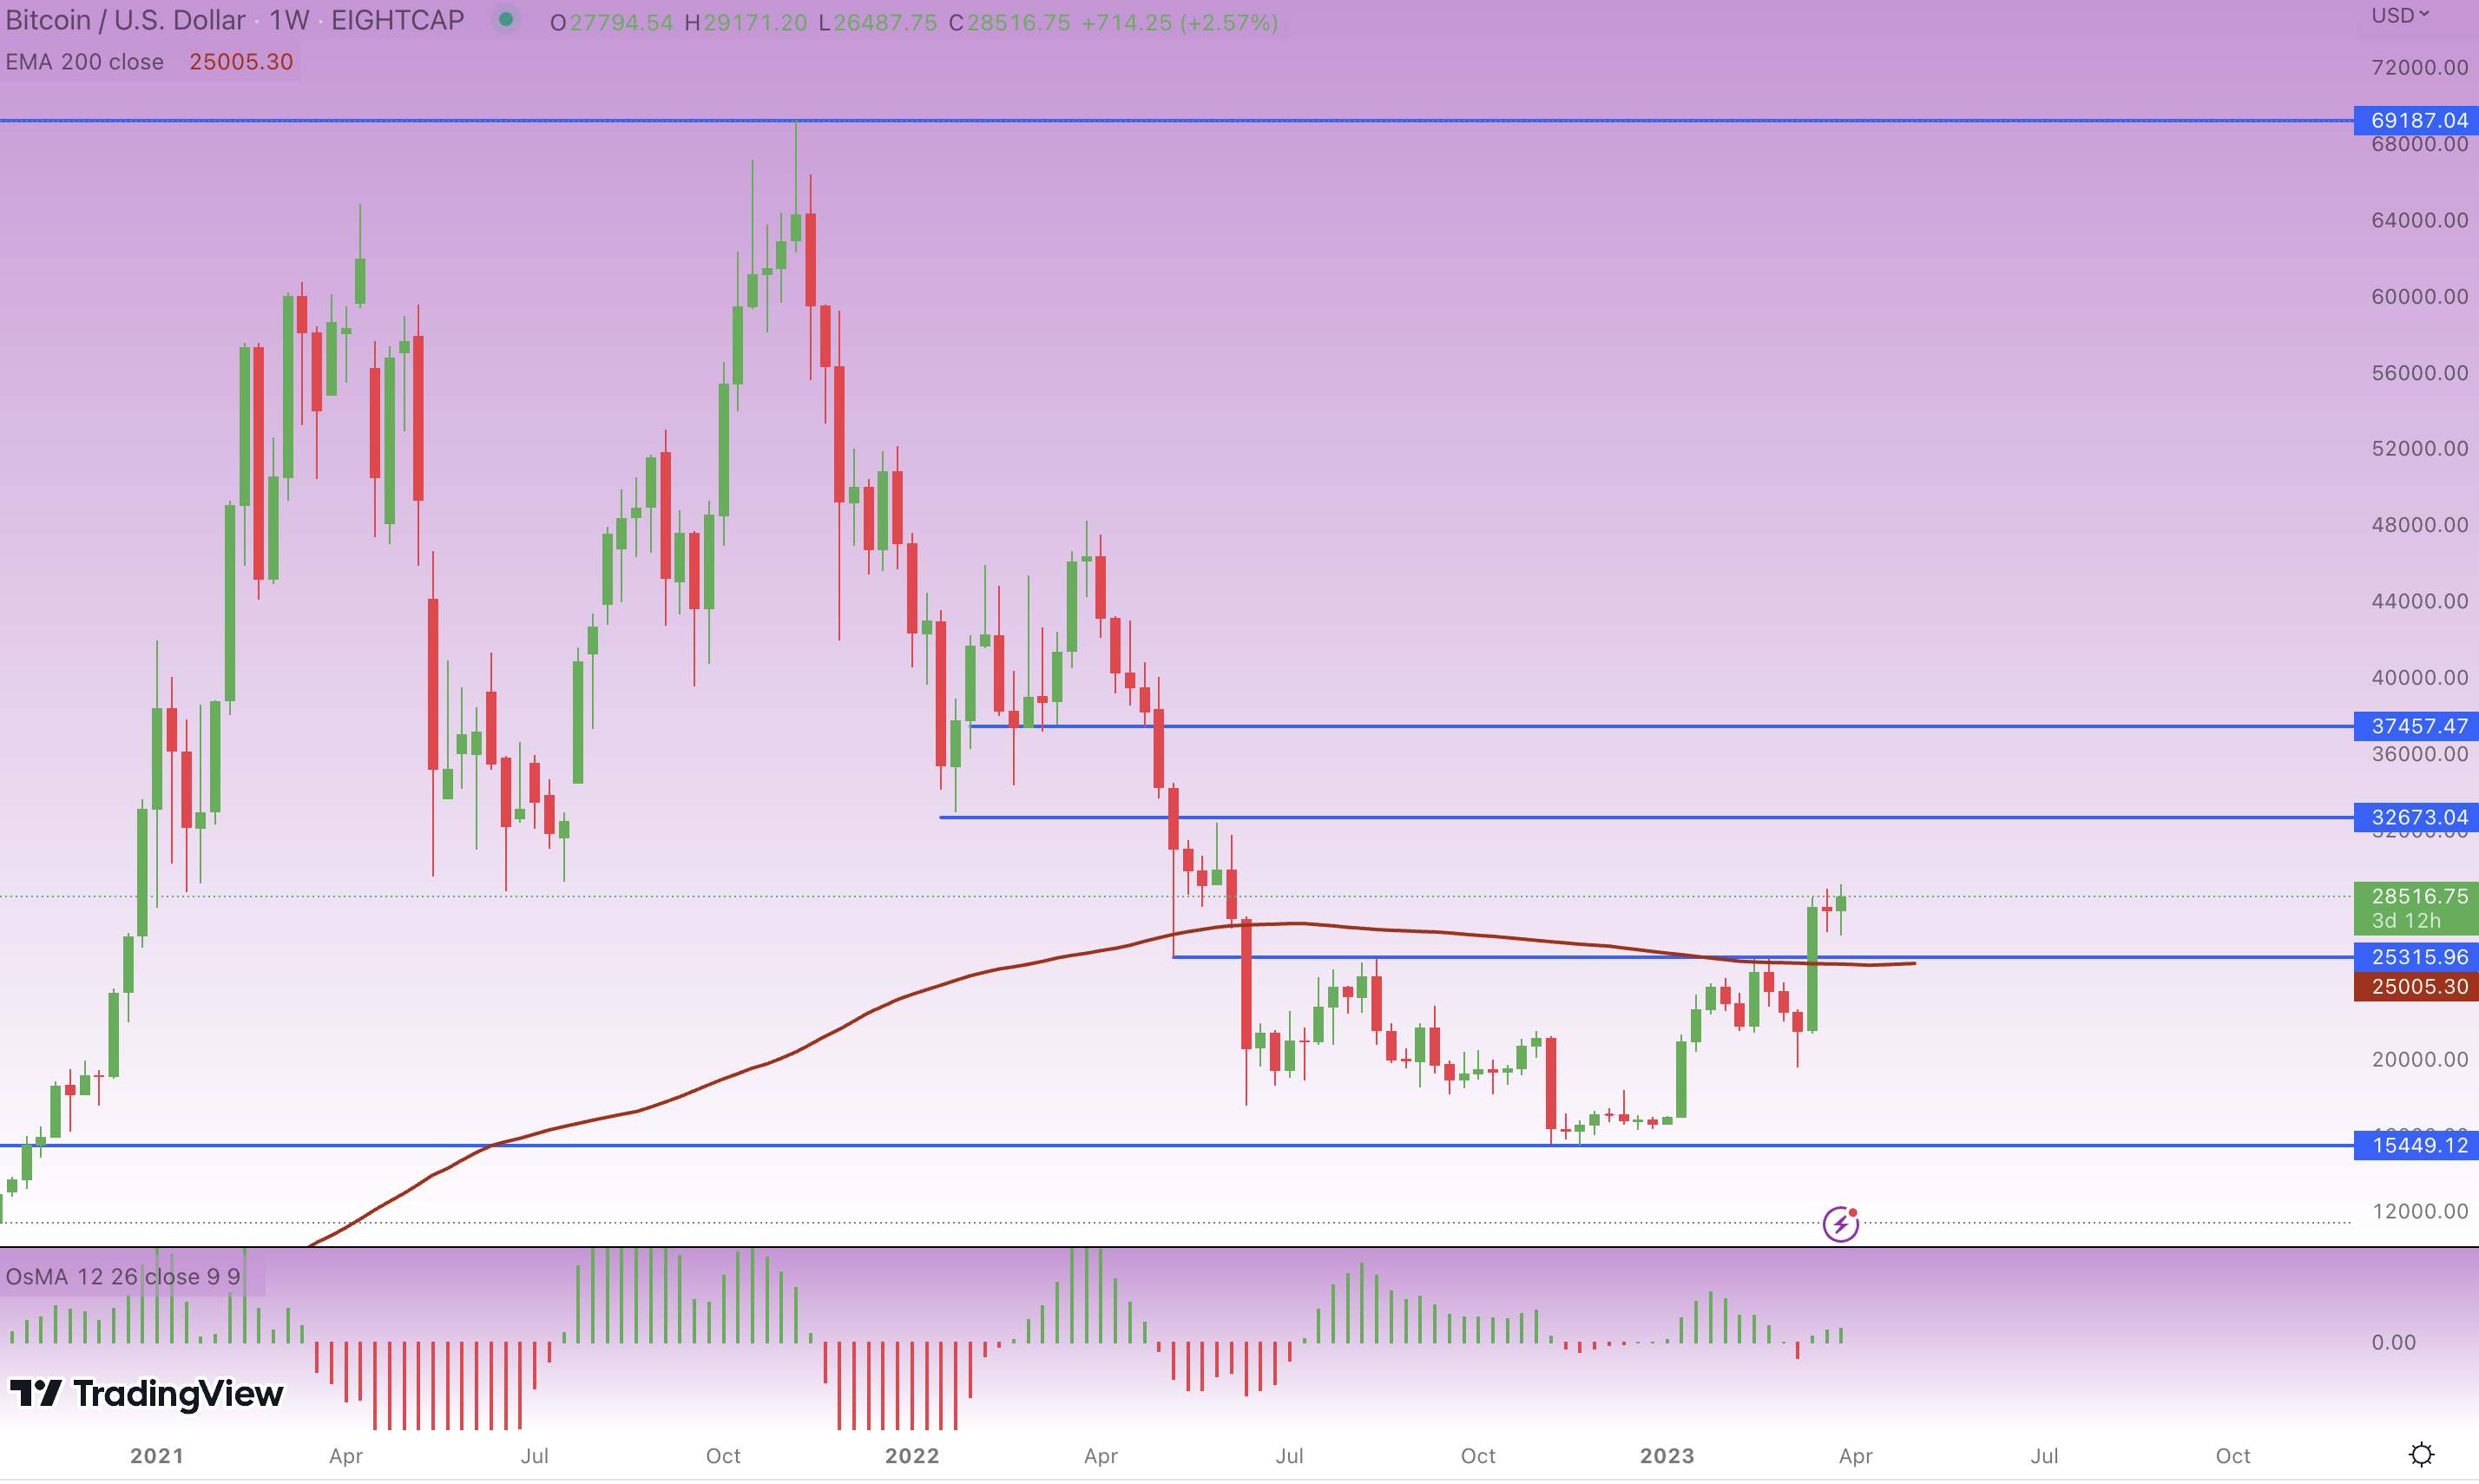
Bitcoin weekly chart, authors’ analysis, source: tradingview.com
The closest target for Bitcoin in the near future is approximately $32,673. Let’s look at the daily chart to see why.
Related podcast: #3: Organizing Bitcoin-only conference with Jordan Walker
The resistance $32,673 was well-respected in the past, indicating this is where the market could stop for a while. Bitcoin is showing signs of a healthy uptrend, regularly creating higher lows (HL) and higher highs (HH). Recently, a bullish divergence was confirmed, sending Bitcoin even higher.
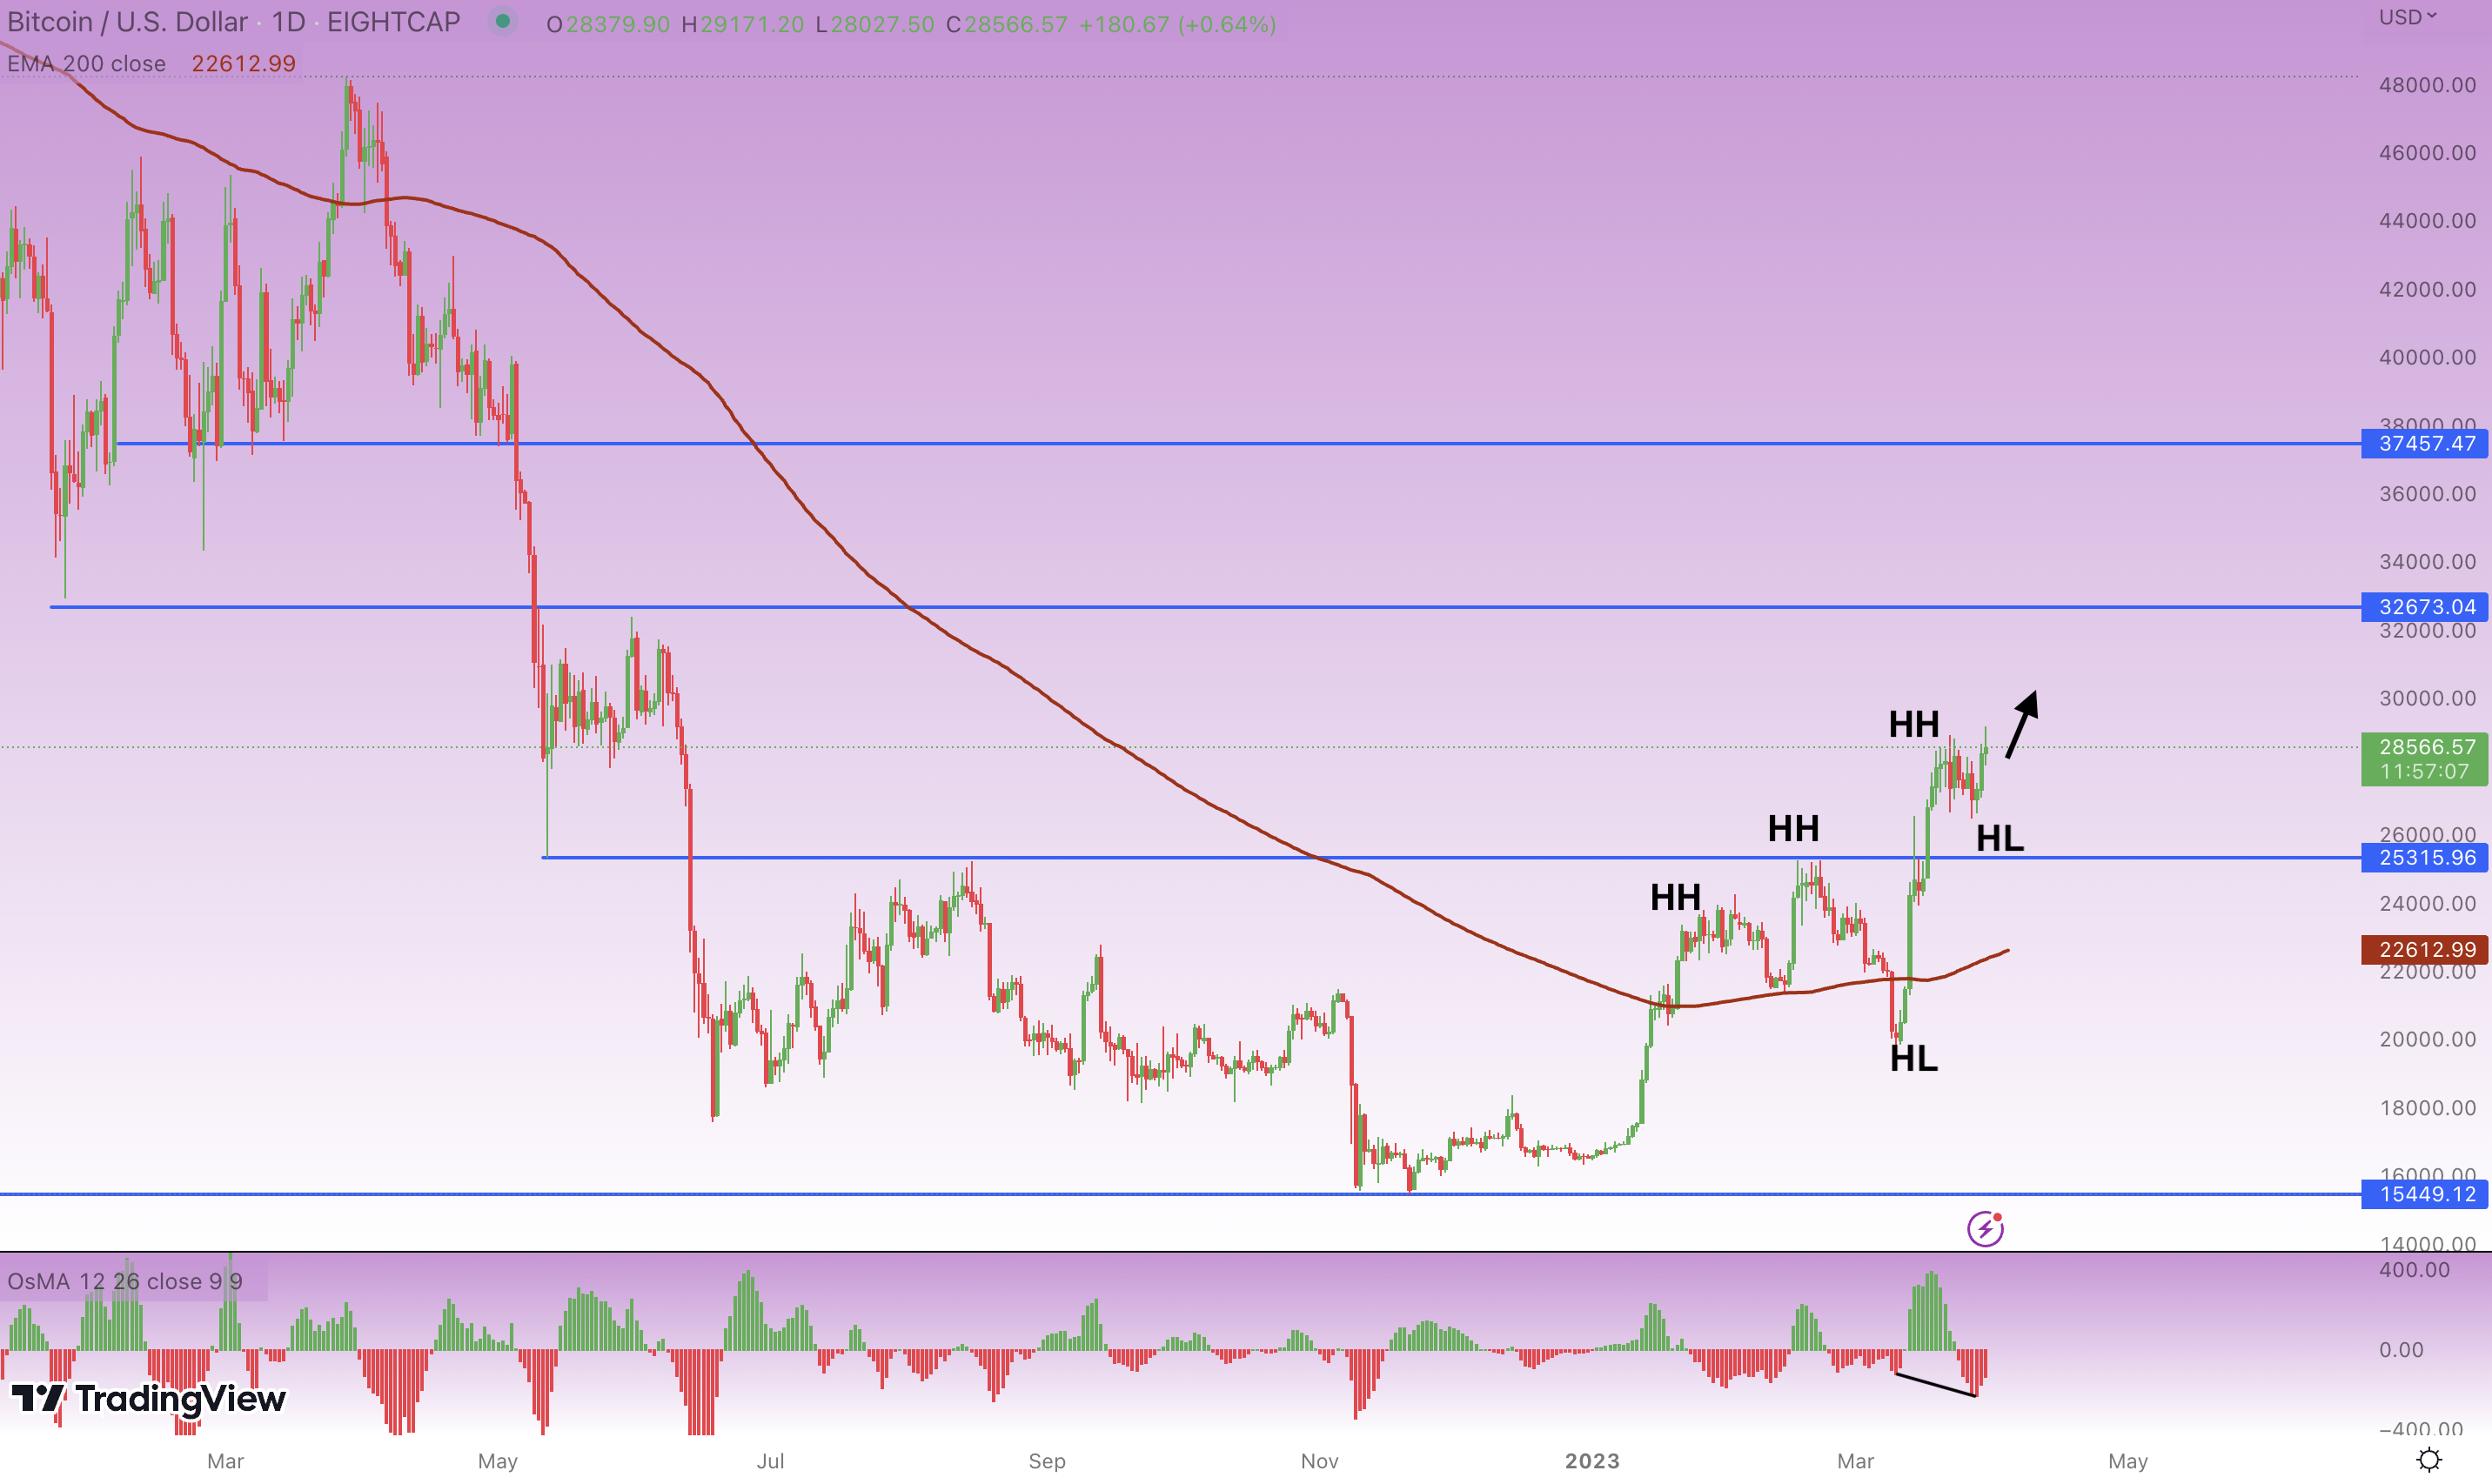
Bitcoin daily chart, authors’ analysis, source: tradingview.com
While investors are getting overly optimistic again, it doesn’t have to mean Bitcoin is going to crash back down from the resistance level. There’s an open space for Bitcoin to rise until at least to $32,673, if not $37,457. It’s also important to mention that there is a Fibonacci 50% level at around $35k.
That means Bitcoin could stop between those two levels and then do a significant correction. The ongoing bullish momentum, however, shows that the bulls want to ride the uptrend and go above $30,000 soon.
Also read: Current crypto regulatory challenges in USA – what you need to know
Bitcoin formed a double bottom a few days ago on a 4-hour chart, attacking the previous highs once again. Although this trading pattern may be invalid and Bitcoin could fall to approximately $25,000, the bullish momentum is undeniable.
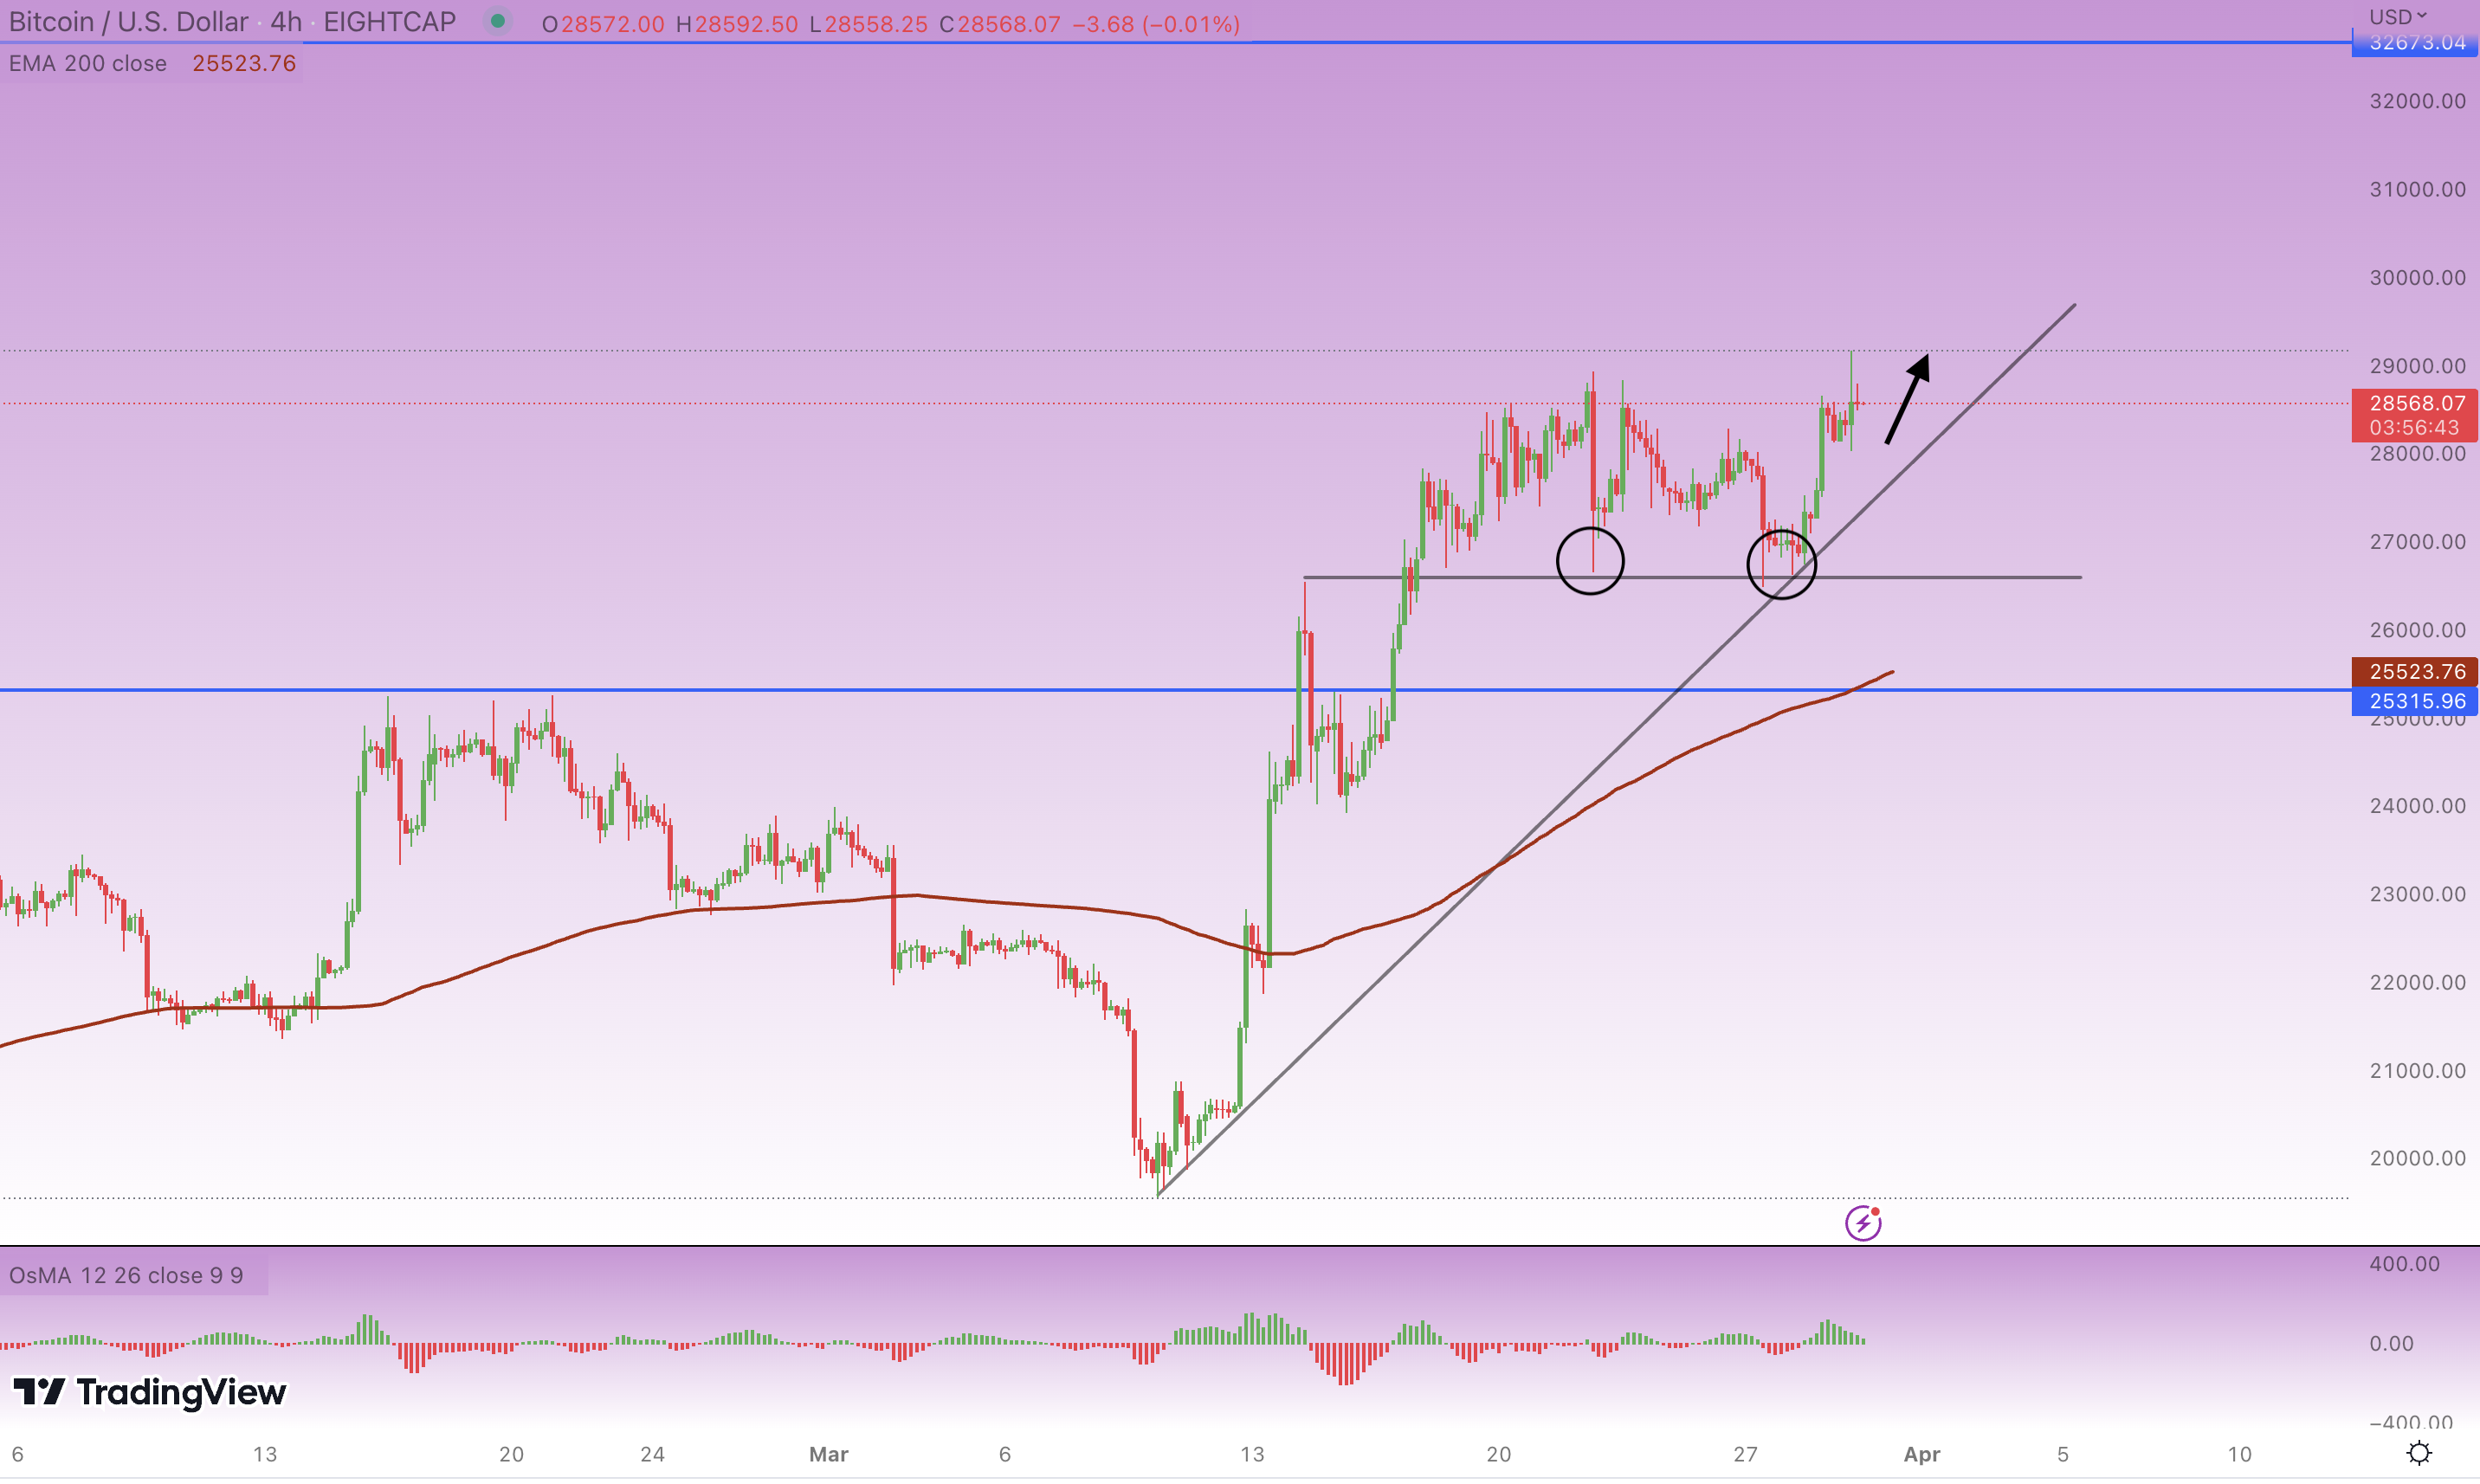
Bitcoin 4-hour chart, authors’ analysis, source: tradingview.com
The weakening of the US dollar, the banking crisis – all of these events are only fuelling Bitcoin for more upward moves. However, it is important to remember that the correlation between the stock market and cryptocurrencies is still high, so if US stocks turn south, Bitcoin could follow.


Comments
Post has no comment yet.