The years 2021 and 2022 have been the years of massive growth for inflation all around the world. That helped the prices of all kinds of goods, including commodities, to skyrocket. For example, the oil literally grew from a $0 price to approximately $130. Is this a top?
Related blog: Iran’s oil export revenues up 580%
Oil WTI technical analysis
While looking at the chart of oil WTI, you can see the severe crash in 2020 and the strong bounce upward that followed. When oil found its temporary peak at $130, it was likely to go even higher, but everything changed after it failed to break the vital resistance of $130. The market declined to create a new top and broke the trend line shown in the graph.
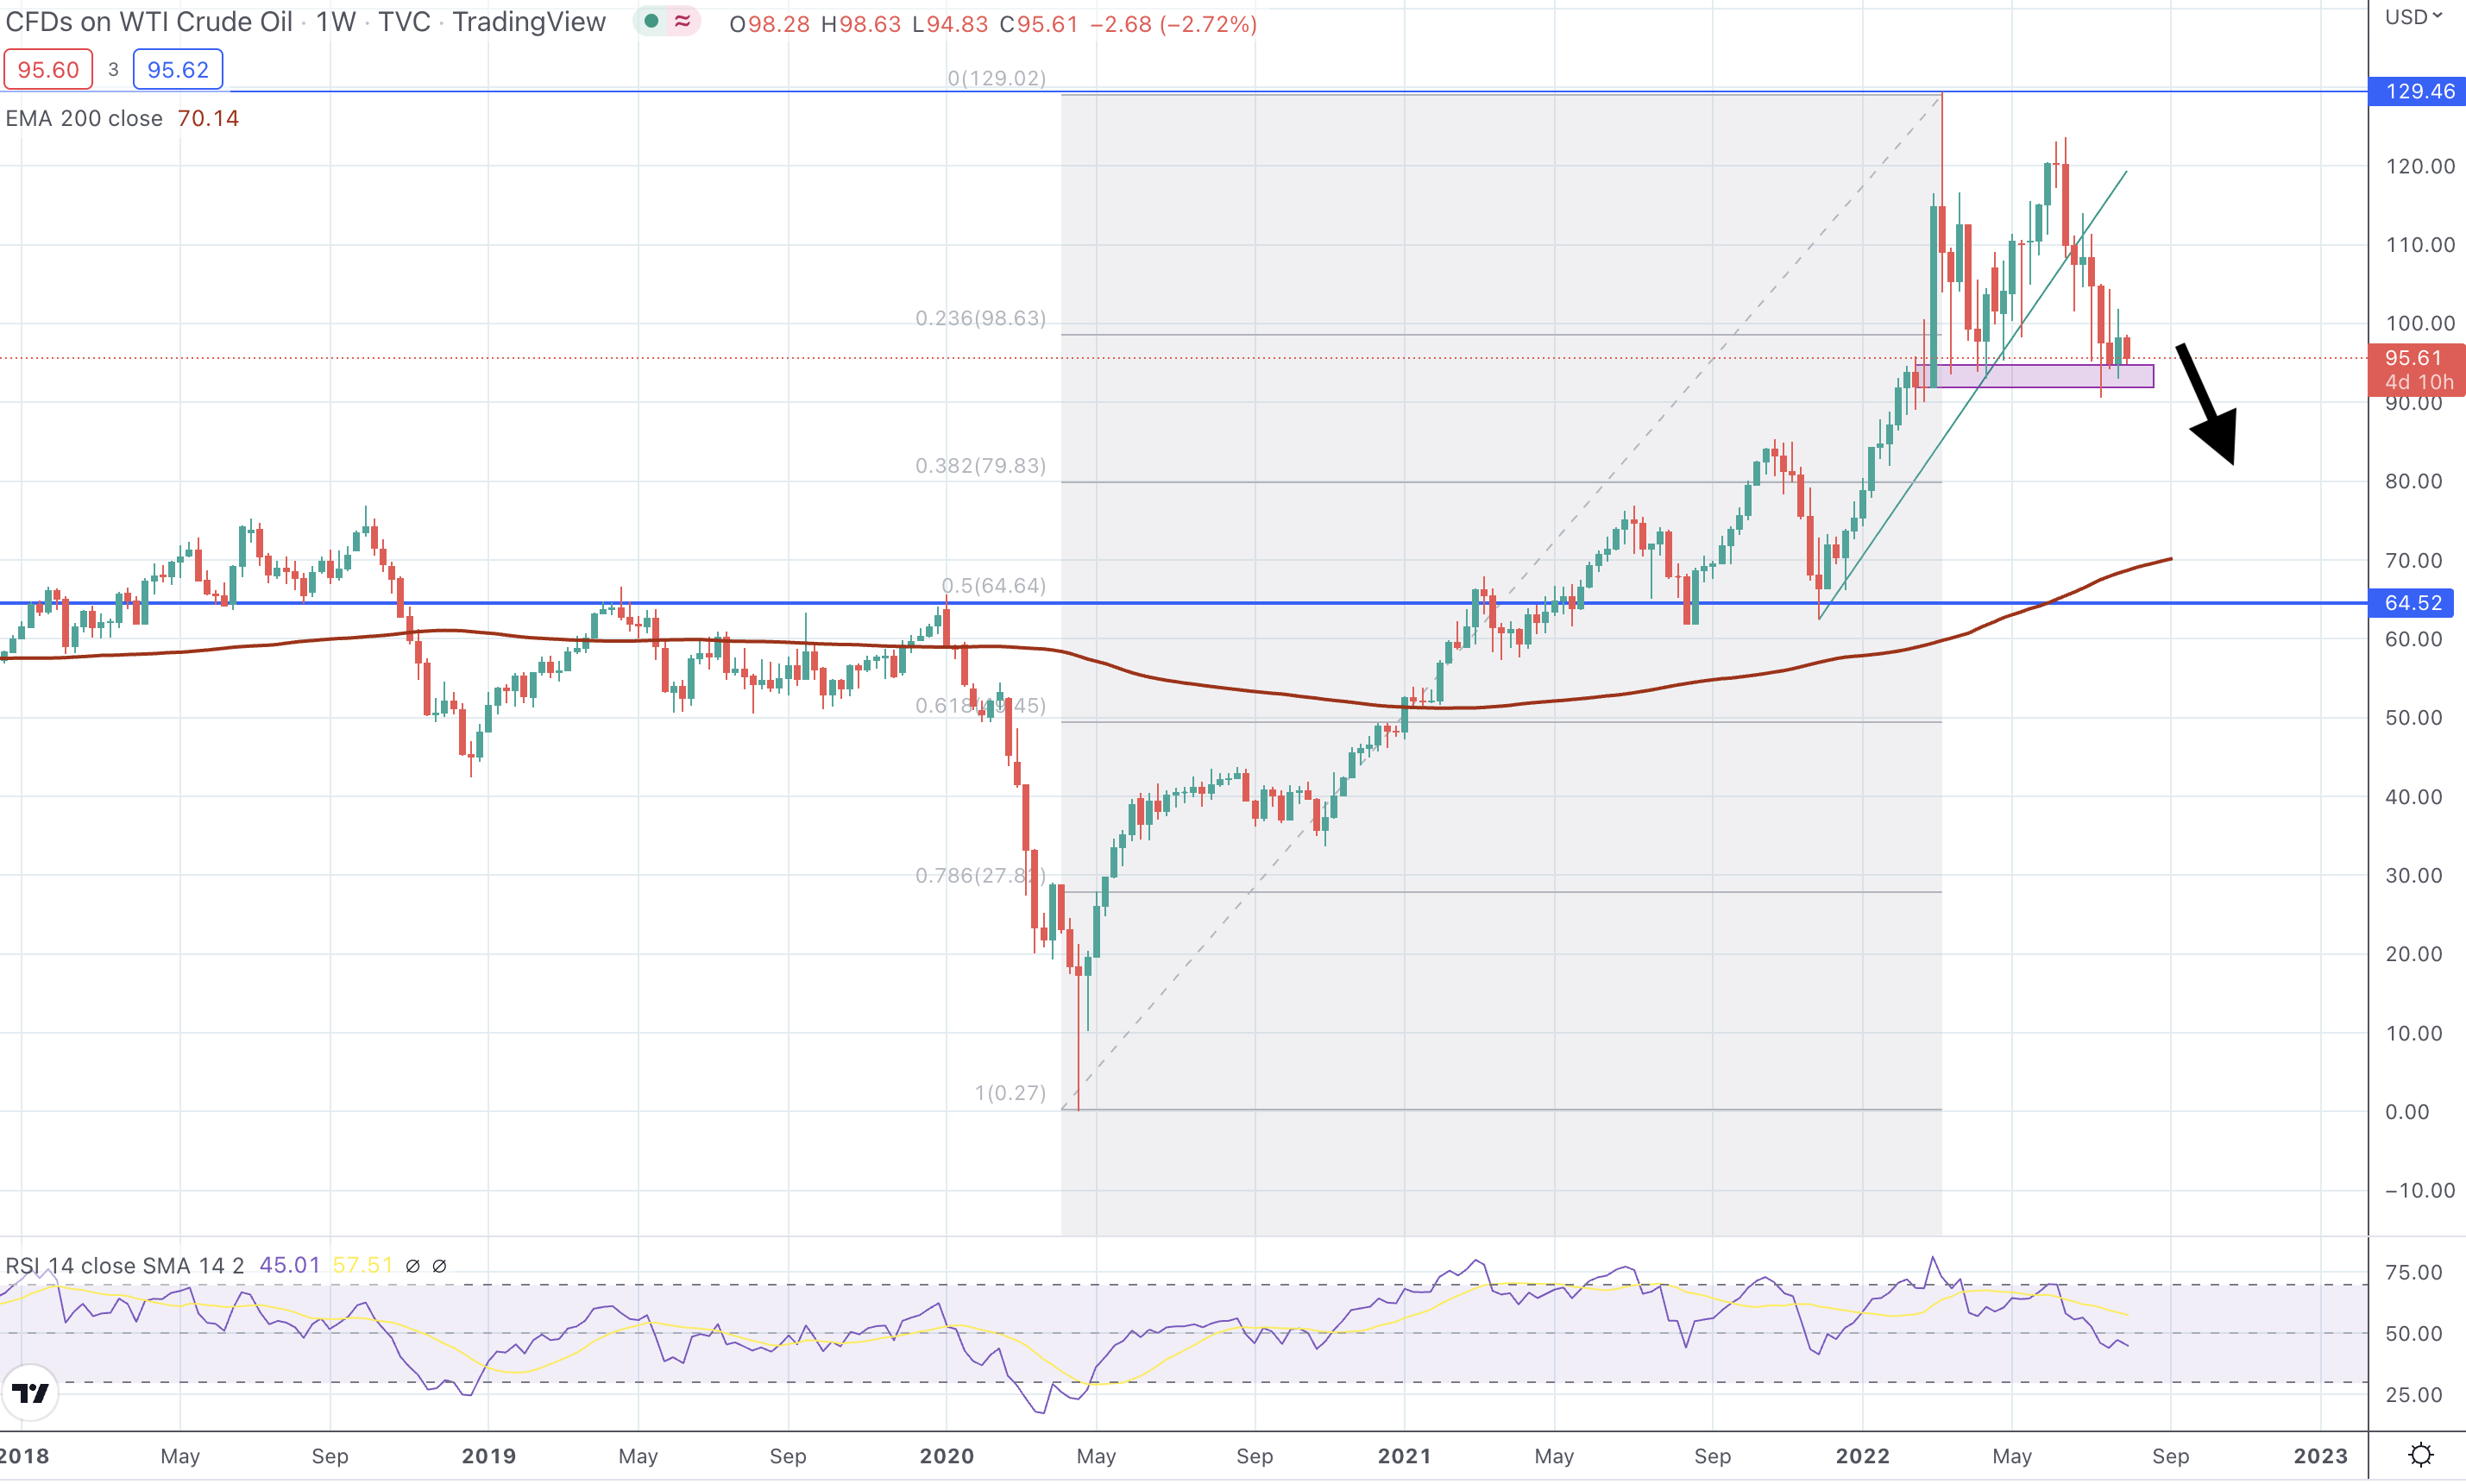
Oil WTI weekly chart, source: tradingview.com
Now it sits on a crucial support, which might get broken as well. If that happens, a move to Fibonacci level 0.382 ($80) is very probable, and a move to Fibonacci level 0.5 ($65) could follow too. OPEC or some data could help move oil prices a little higher, but it would not probably last long as the whole market is considered overvalued.
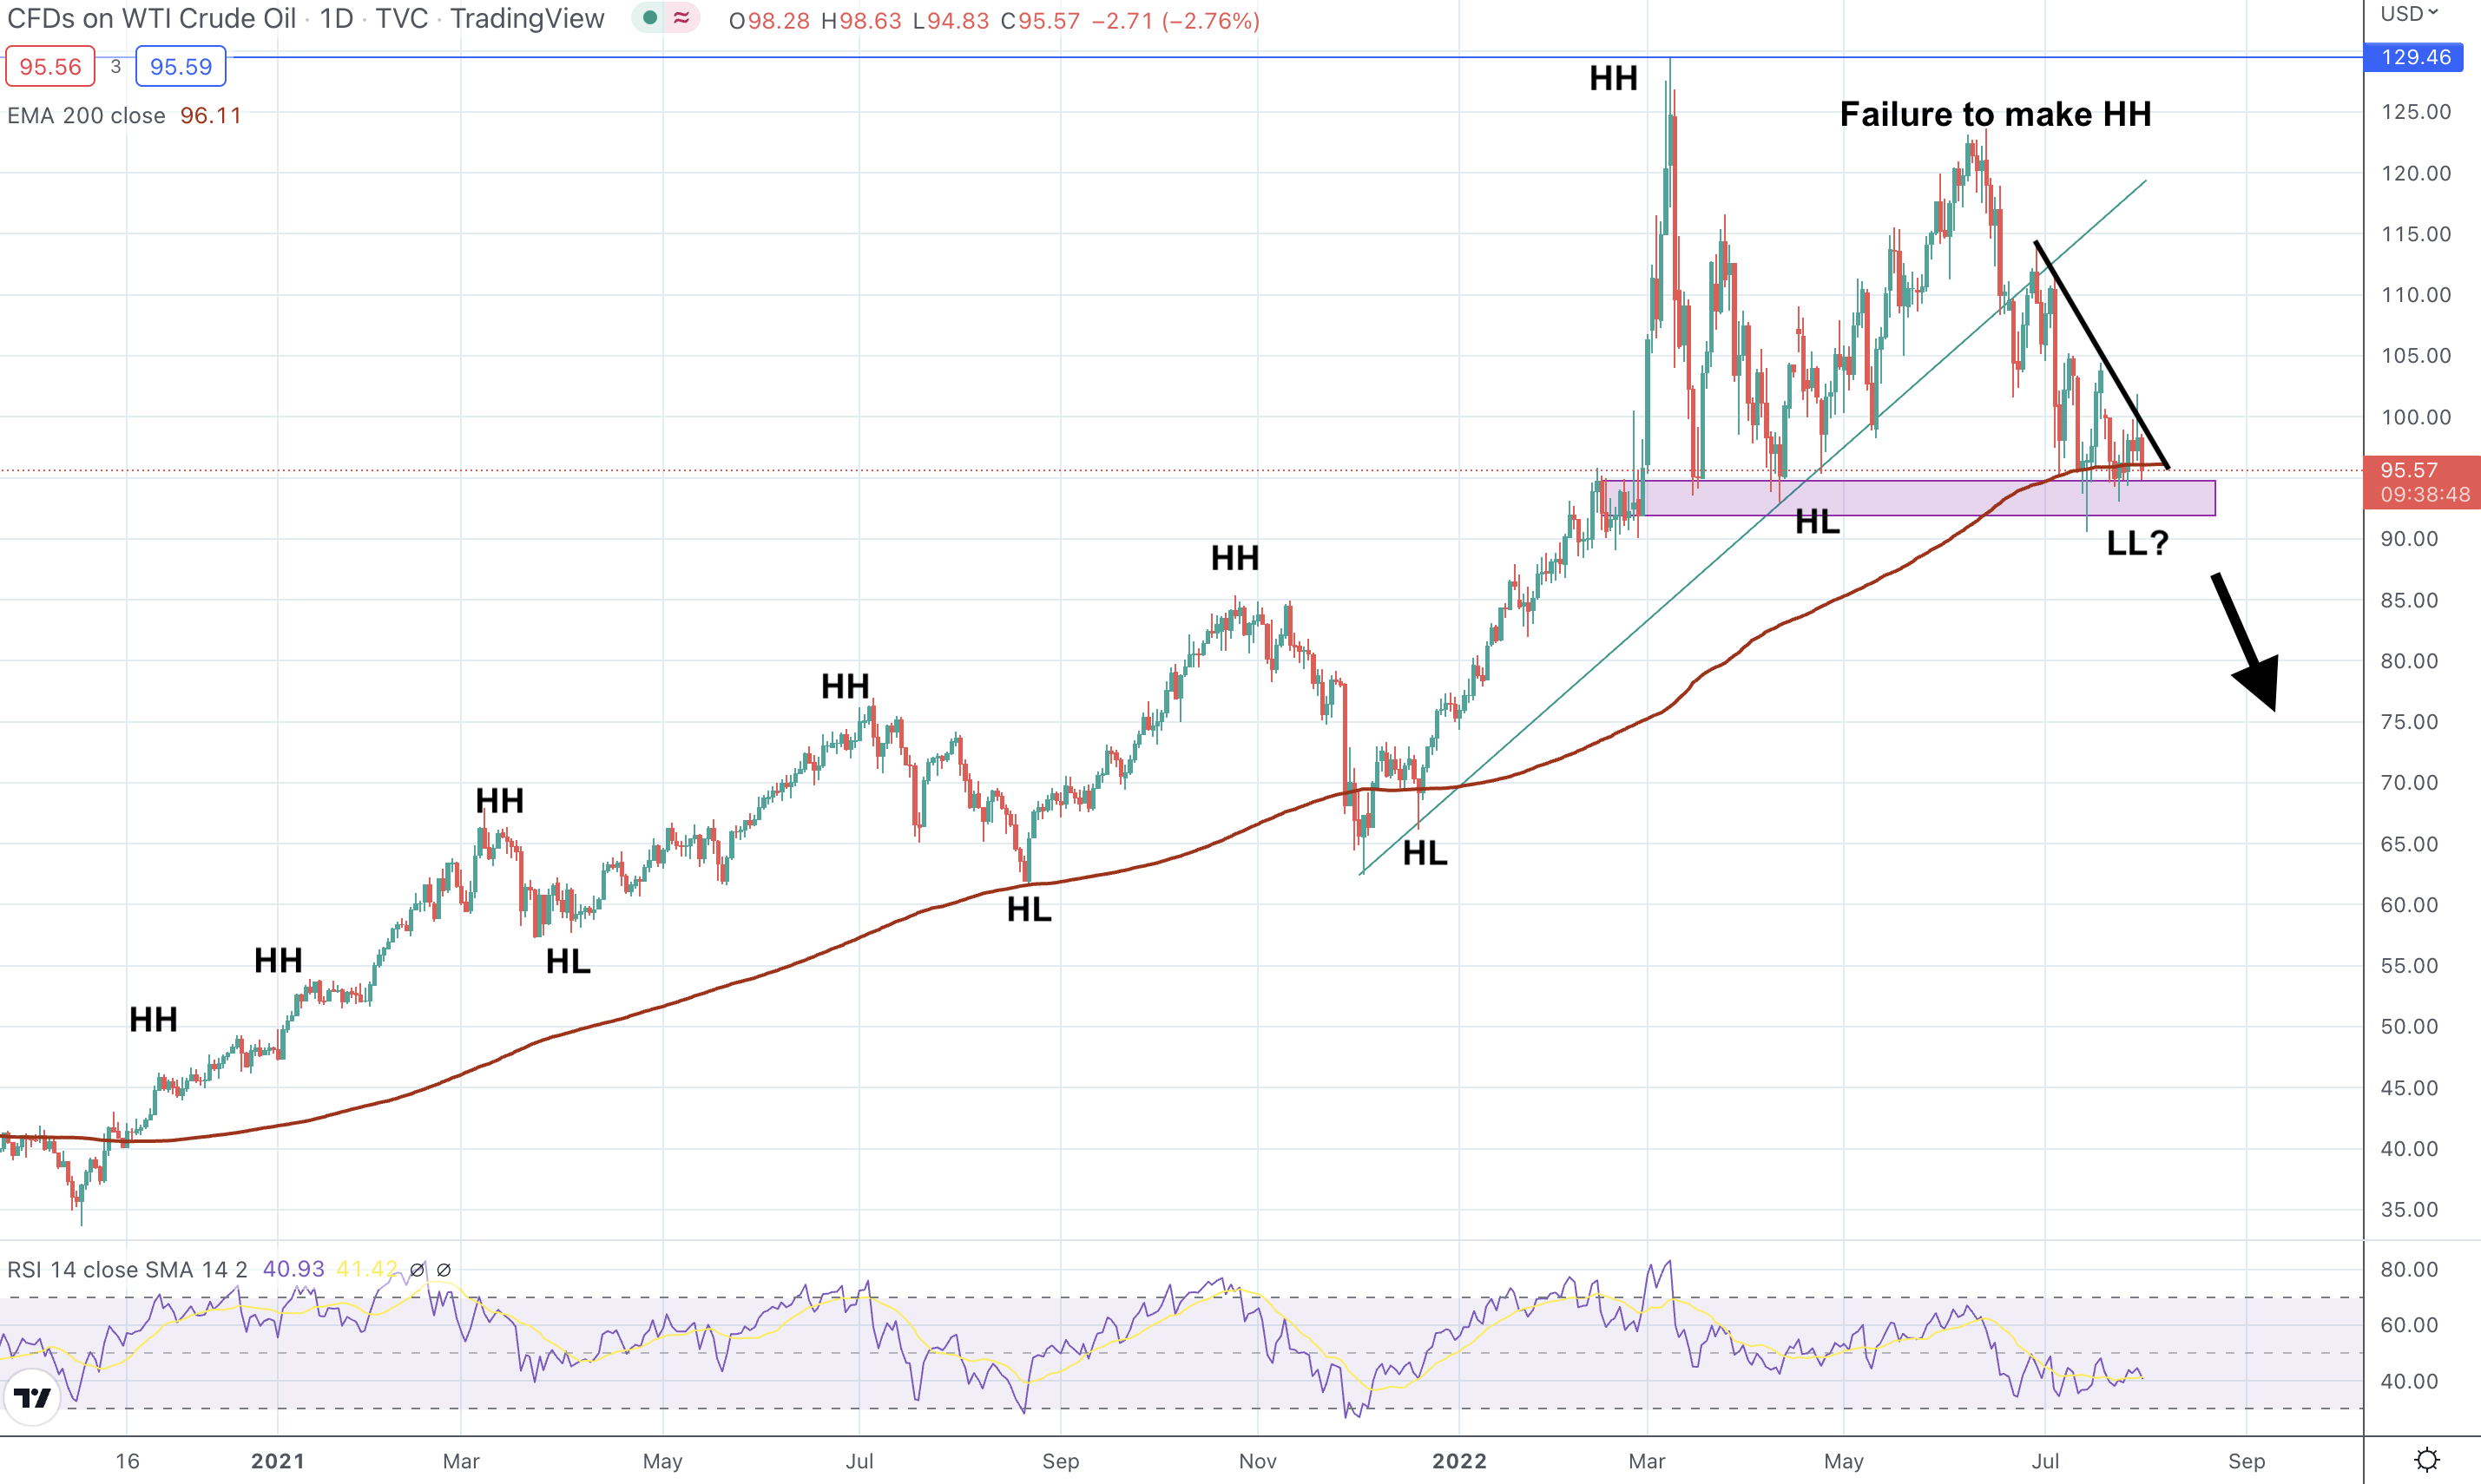
Oil WTI daily chart, source: tradingview.com
Oil was able to keep a steady uptrend for many months. There were many higher highs (HH) and higher lows (HL) that kept the uptrend going. Oil WTI also bounced from a moving average EMA200 several times, but things have changed.
The market clearly failed to make a higher high and is now putting pressure on support and EMA200, with a possibility of creating a first lower low in a long time. If that happens, doors to $80 or $65 are open, meaning a 30% correction might be around the corner.
You may also read: Crypto news summary: Cathie Wood, El Salvador, and Shiba Inu
Natural gas technical analysis
The daily timeframe shows the colossal uptrend that came in 2021 and how it peaked in 2022. Natural gas rose by hundreds of percent in a matter of two years like its correlated commodity oil. However, gas failed to break the important level of $10 two times in a row, potentially forming a double top.
There is a very obvious pin bar and an engulfing pattern that traders will follow, probably drawing the price even lower in the next few weeks. RSI indicator also shows a bounce from a significantly overbought area, and a further price decline to EMA200 is in the game.
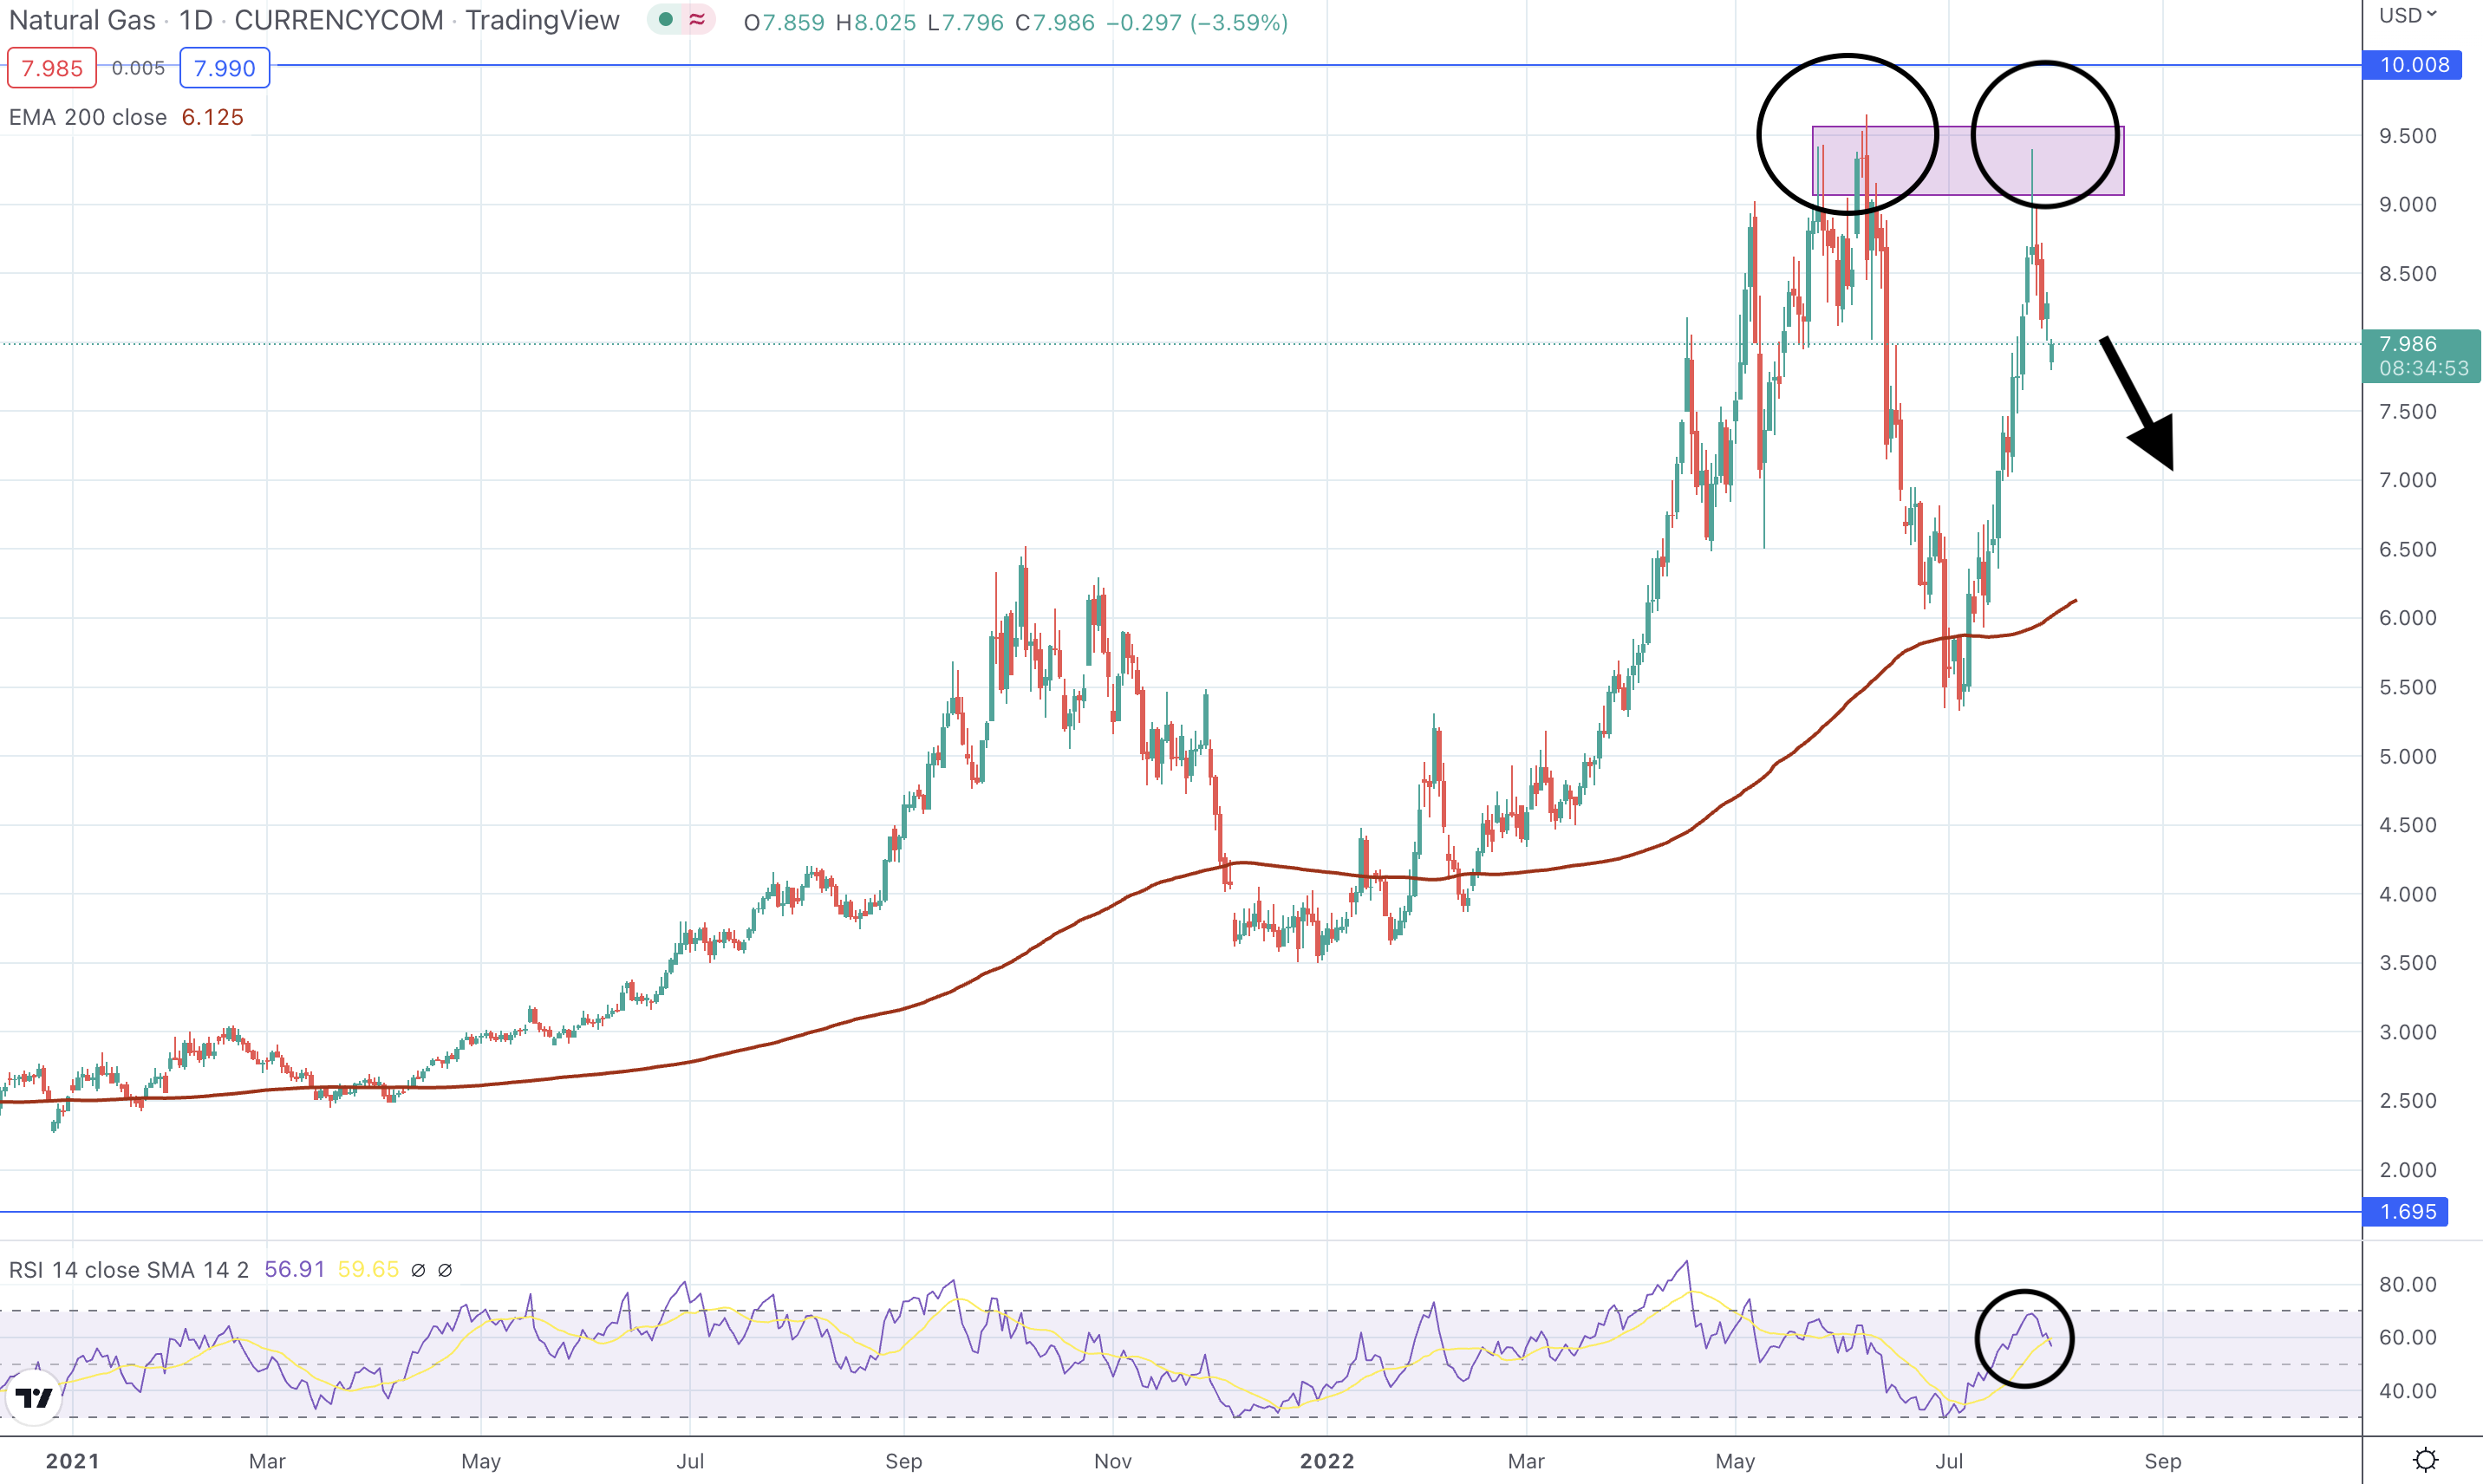
Natural gas daily chart, source: tradngview.com
If Fibonacci retracement is calculated correctly, gas could fall to at least 0.382 ($6.5) or even 0.5 Fibonacci level ($5.5), where there is also an important trend line. Natural gas skyrocketed from just $1.55 to almost $10, so several analysts expect an inevitable price pullback or consolidation.
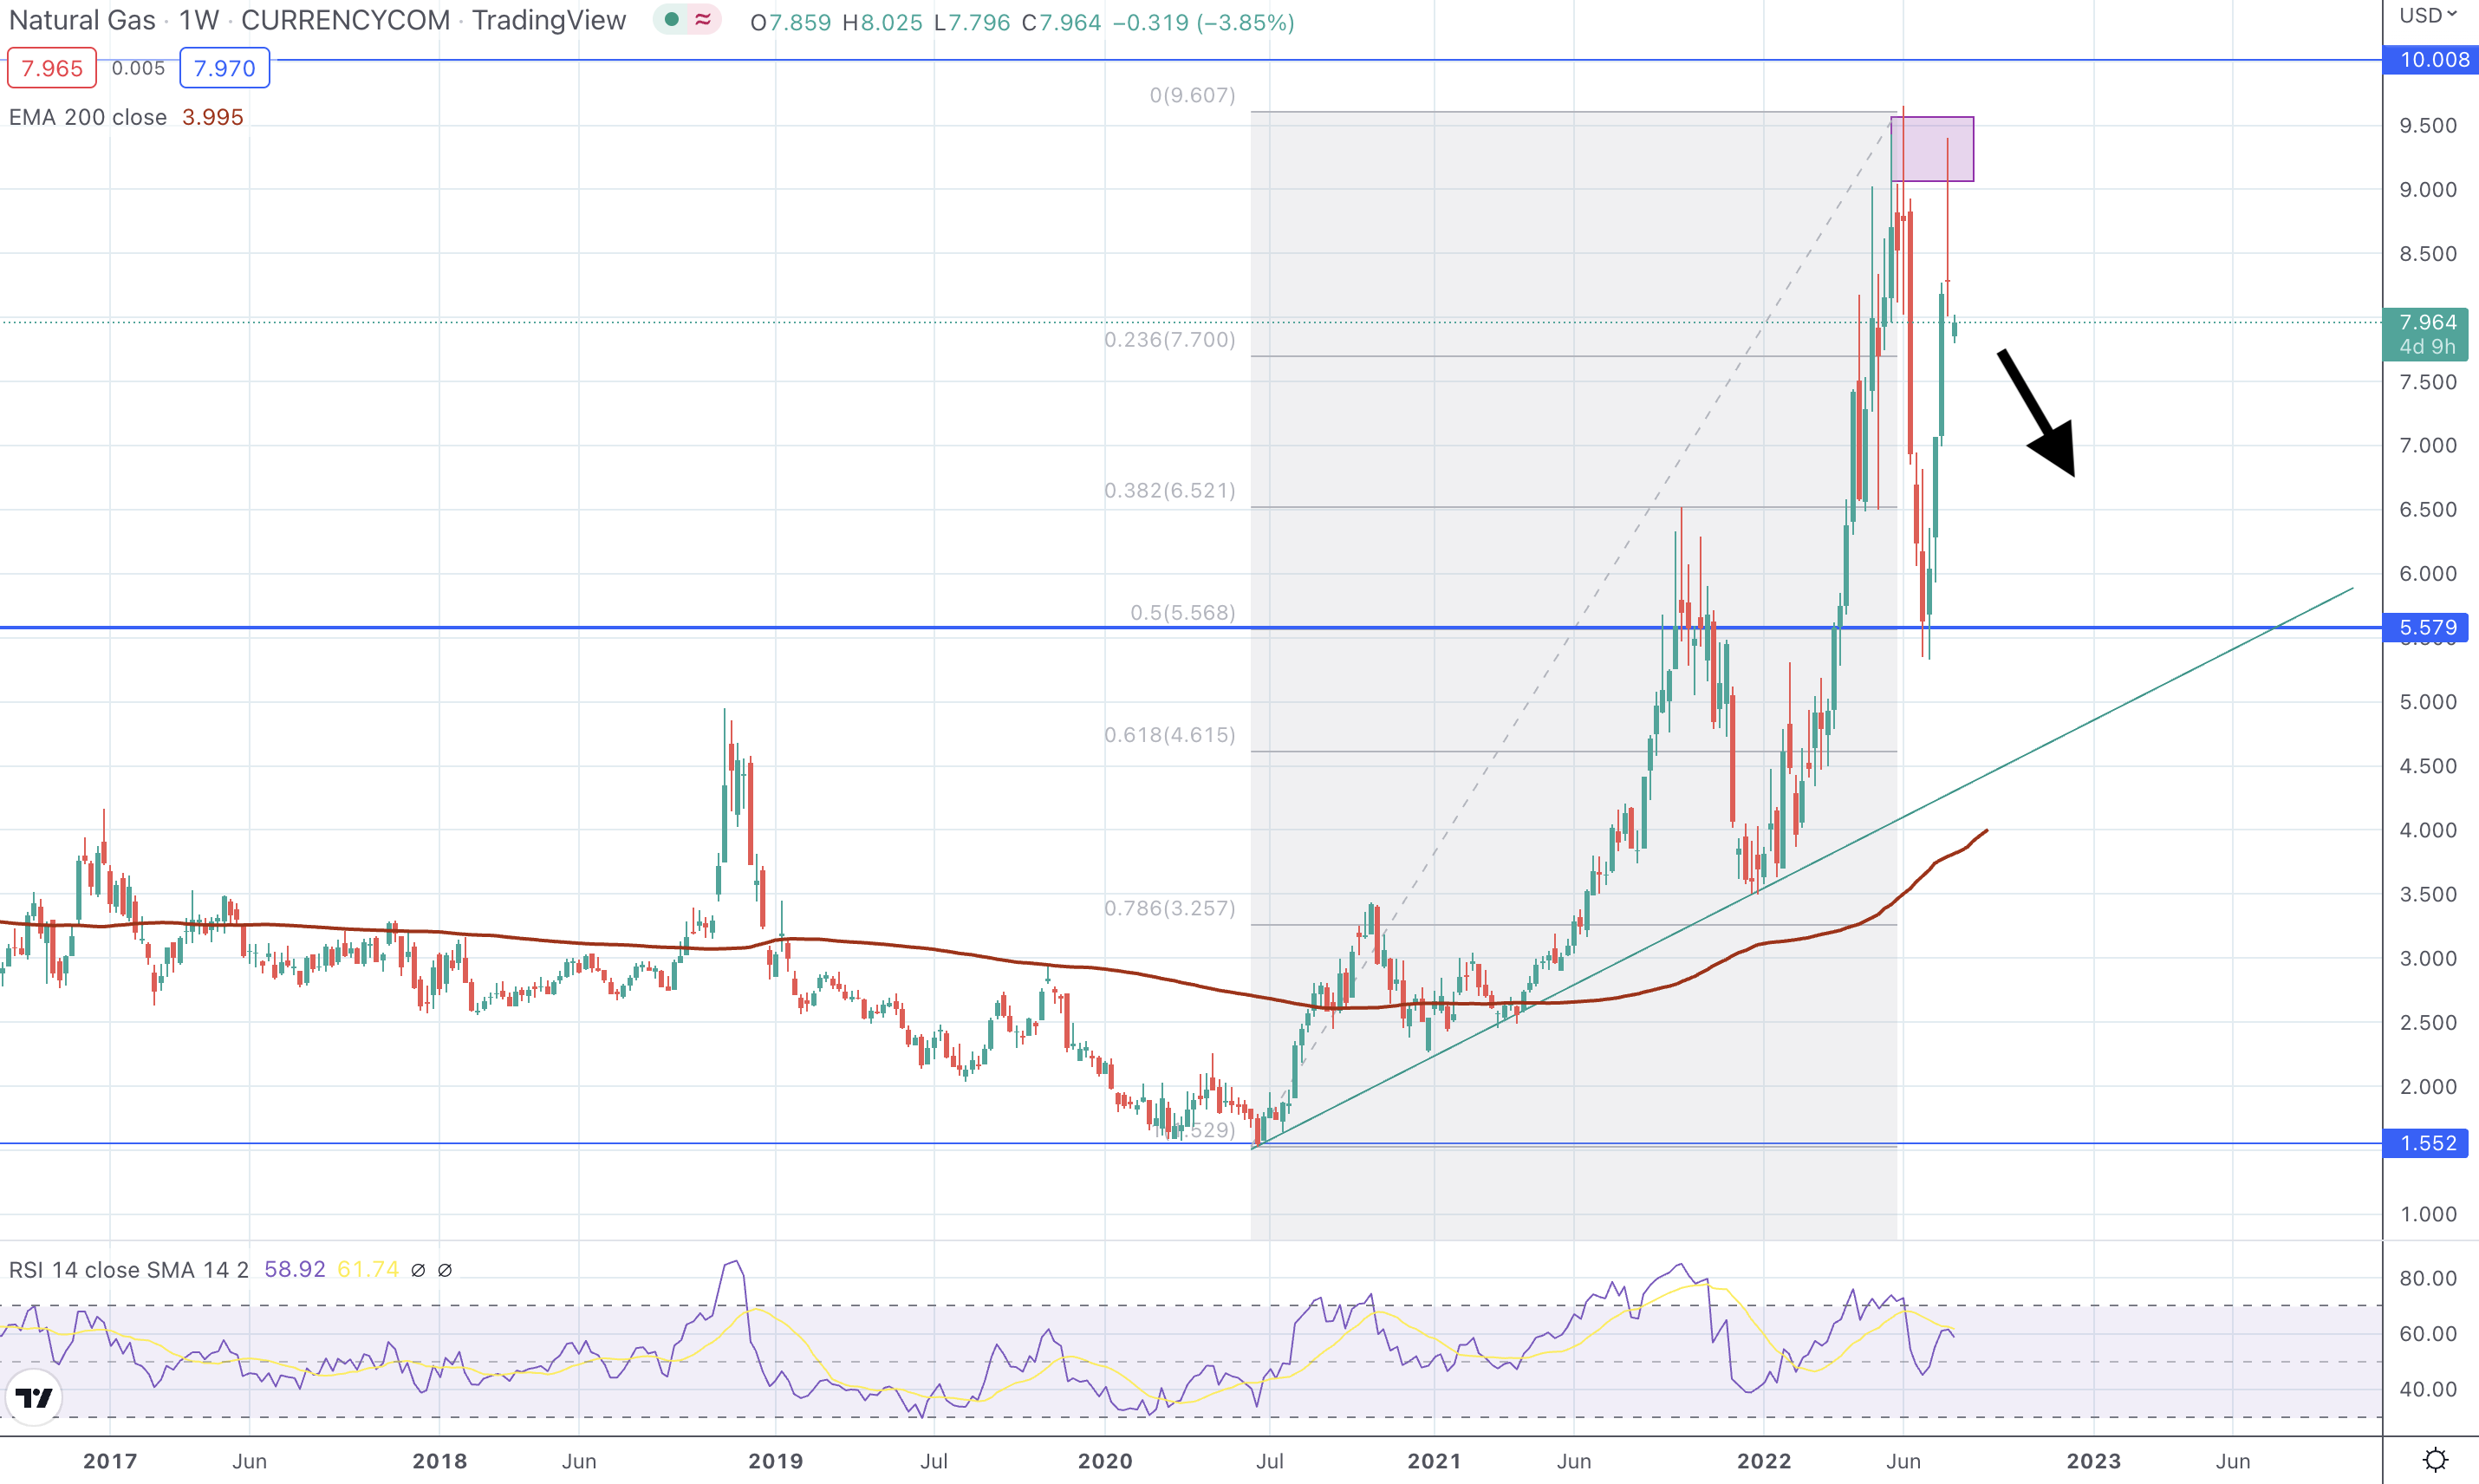
Natural gas weekly chart, source: tradingview.com
The bottom line
Aggressively rising inflation caused the prices of many commodities to skyrocket. However, central banks all over the world have started to hike the interest rates, which should tighten economies and bring the inflation rate down.
This could lead to price declines in all commodities, especially oil and gas. However, it will be essential for OPEC to help oil prices to stabilize with some measures. The OPEC will meet and announce its future plans on August 3.


Comments
Post has no comment yet.